clear all
set more off
cd "/Users/jonathanjayes/Downloads/Lab-1" // set your directory

# Read in the data
use regional_dataset, clearStata Lab 2: Exercises
Setup
Set your working directory and read in the data
Question 1
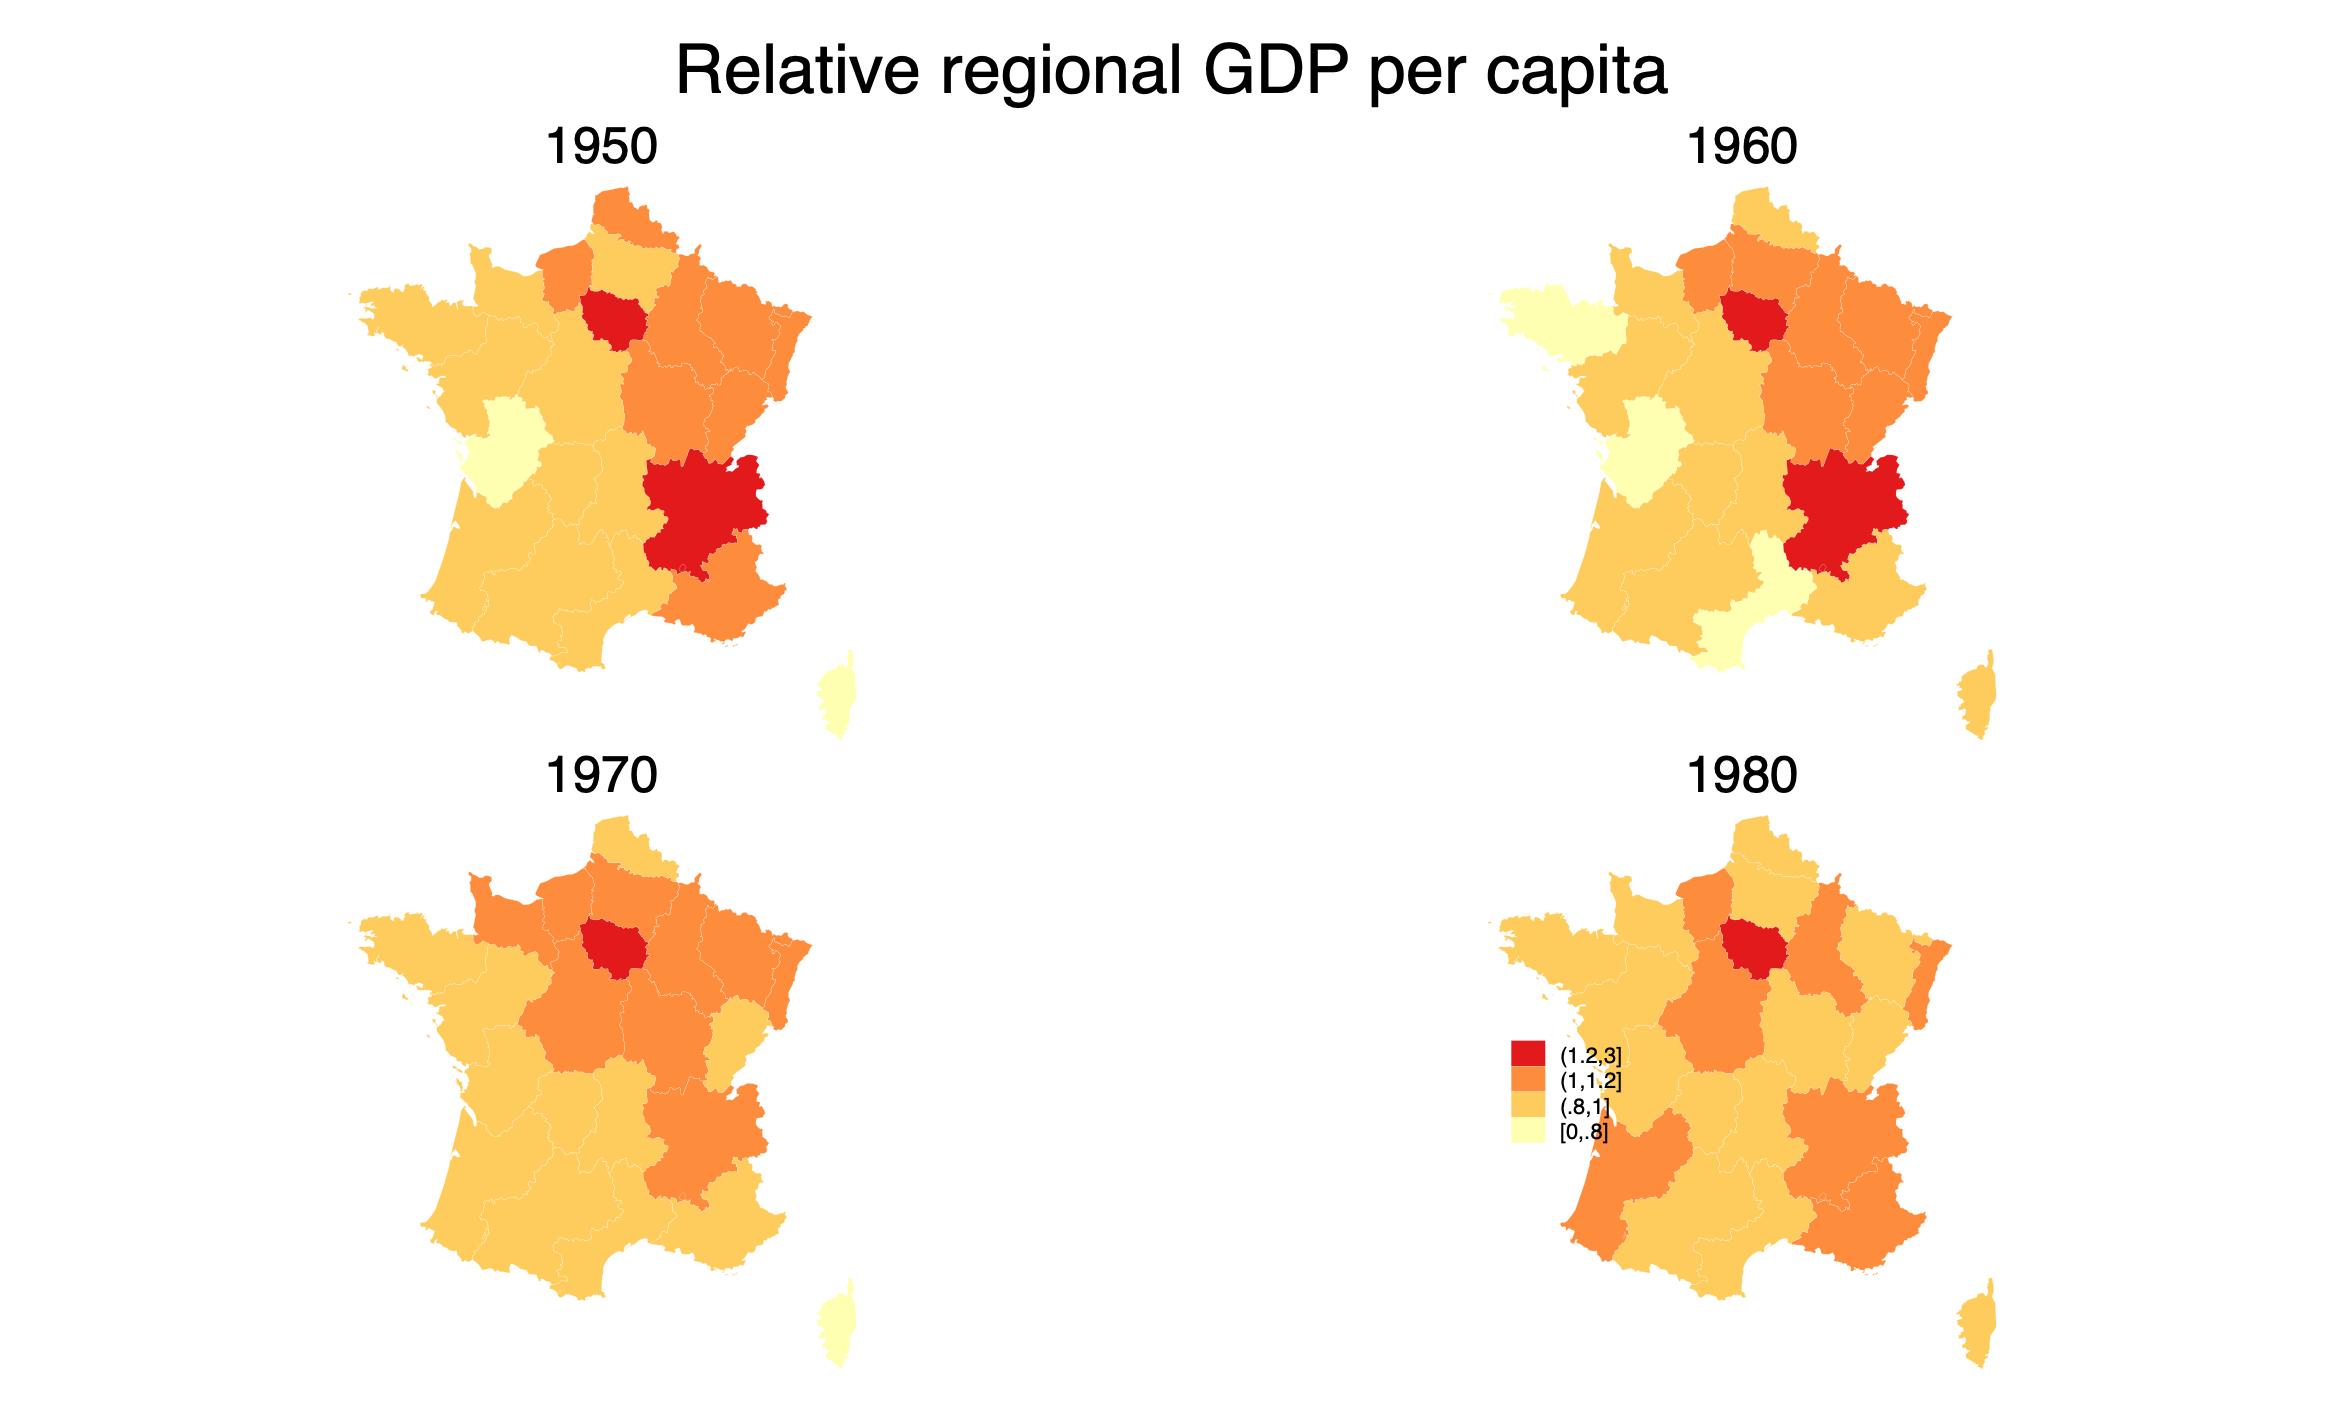
Make a subplot map that compares relative regional GDP per capita in 4 different years and join the maps together (your chosen region).
Try and make it such that there is only one legend in one subplot
# loop through maps without
foreach i of numlist 1950 (10) 1970 {
        spmap relative_gdp_cap_country using "nutscoord.dta" if year == `i' & country == "France", id(_ID) ///
            fcolor(YlOrRd) legend(pos(5)) legstyle(1) ///
            osize(0.02 ..) ocolor(white ..) ///
            clmethod(custom) clbreaks(0 0.8 1 1.2 3) ///
            name(relative_gdp_cap_map_`i', replace) ///
            title(`i') ///
            leg(off)
}

spmap relative_gdp_cap_country using "nutscoord.dta" if year == 1980 & country == "France", id(_ID) ///
            fcolor(YlOrRd) legend(pos(5)) legstyle(1) ///
            osize(0.02 ..) ocolor(white ..) ///
            clmethod(custom) clbreaks(0 0.8 1 1.2 3) ///
            name(relative_gdp_cap_map_1980, replace) ///
            title(1980) ///
            legend(pos(9))

graph combine relative_gdp_cap_map_1950 relative_gdp_cap_map_1960 relative_gdp_cap_map_1970 relative_gdp_cap_map_1980, title("Relative regional GDP per capita")
Question 2
Make a beta convergence plot (your region of choice) Add labels to the plot for three of your regions
See this post for more information on beta convergence.
Question 3
Make a map that highlights a region that you want to discuss with a dotted line (any region)
See this post for more information on how to make a map with a dotted line to highlight a region.