A short scoping line — who this is for and what it decides
2026-09-18

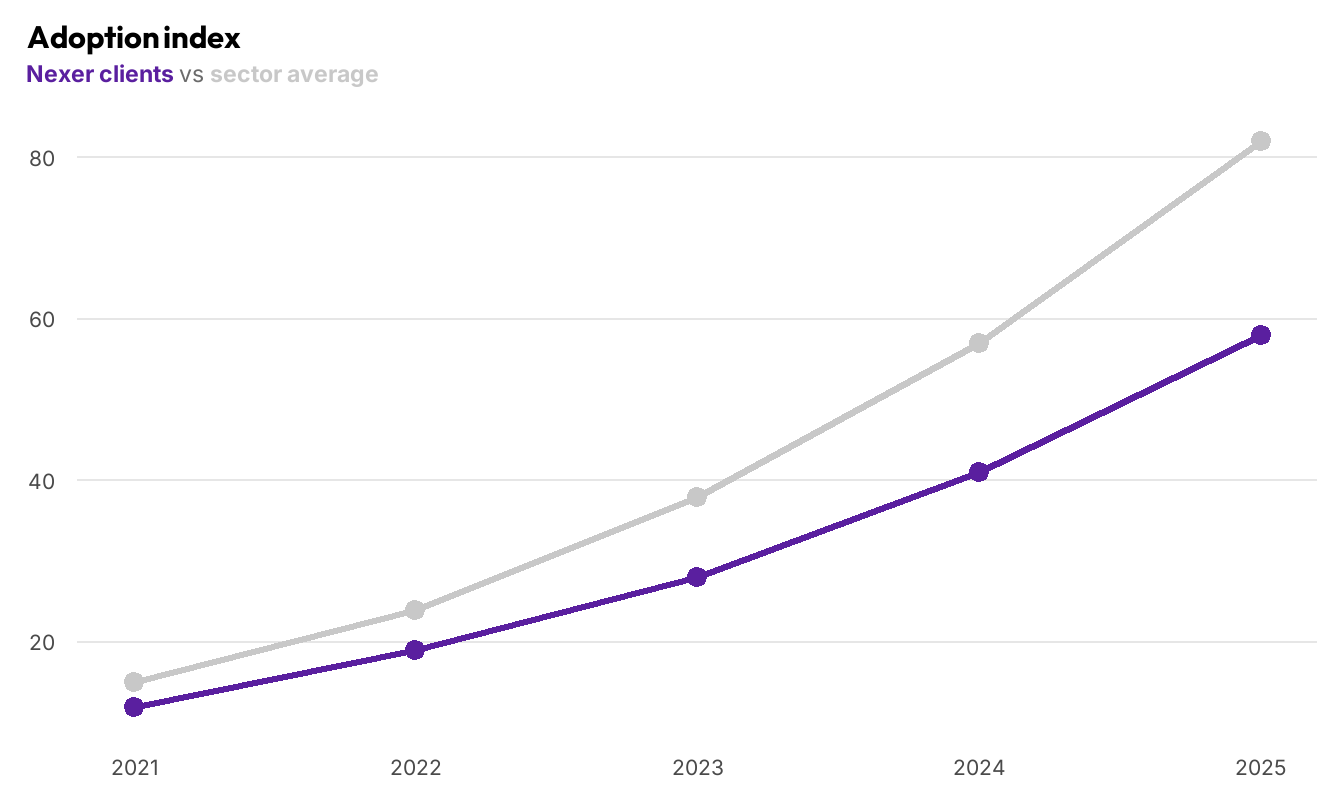
Index, 2021 = 12
The gap is a distribution problem, not a capability one.
Note: Index rebased to 2021. Source: Internal benchmark; sector survey 2025
82 M€ Cost saved
16 Countries
2 450 Employees
~6 wks Time to value
Every figure on this slide is sourced below. A number without a base is decoration.
Source: Nexer Group annual report 2025; PostNord engagement summary
| Route | What it involves | Risk sits with | Time to value |
|---|---|---|---|
| Pilot first | One team, one workflow, fixed scope | Nexer | ~6 weeks |
| Platform first | Build shared tooling, then onboard teams | Shared | ~6 months |
| Buy and adapt | Licence a vendor product, configure it | Client | ~3 months |
Note: Time to value measured from contract signature to first production use.
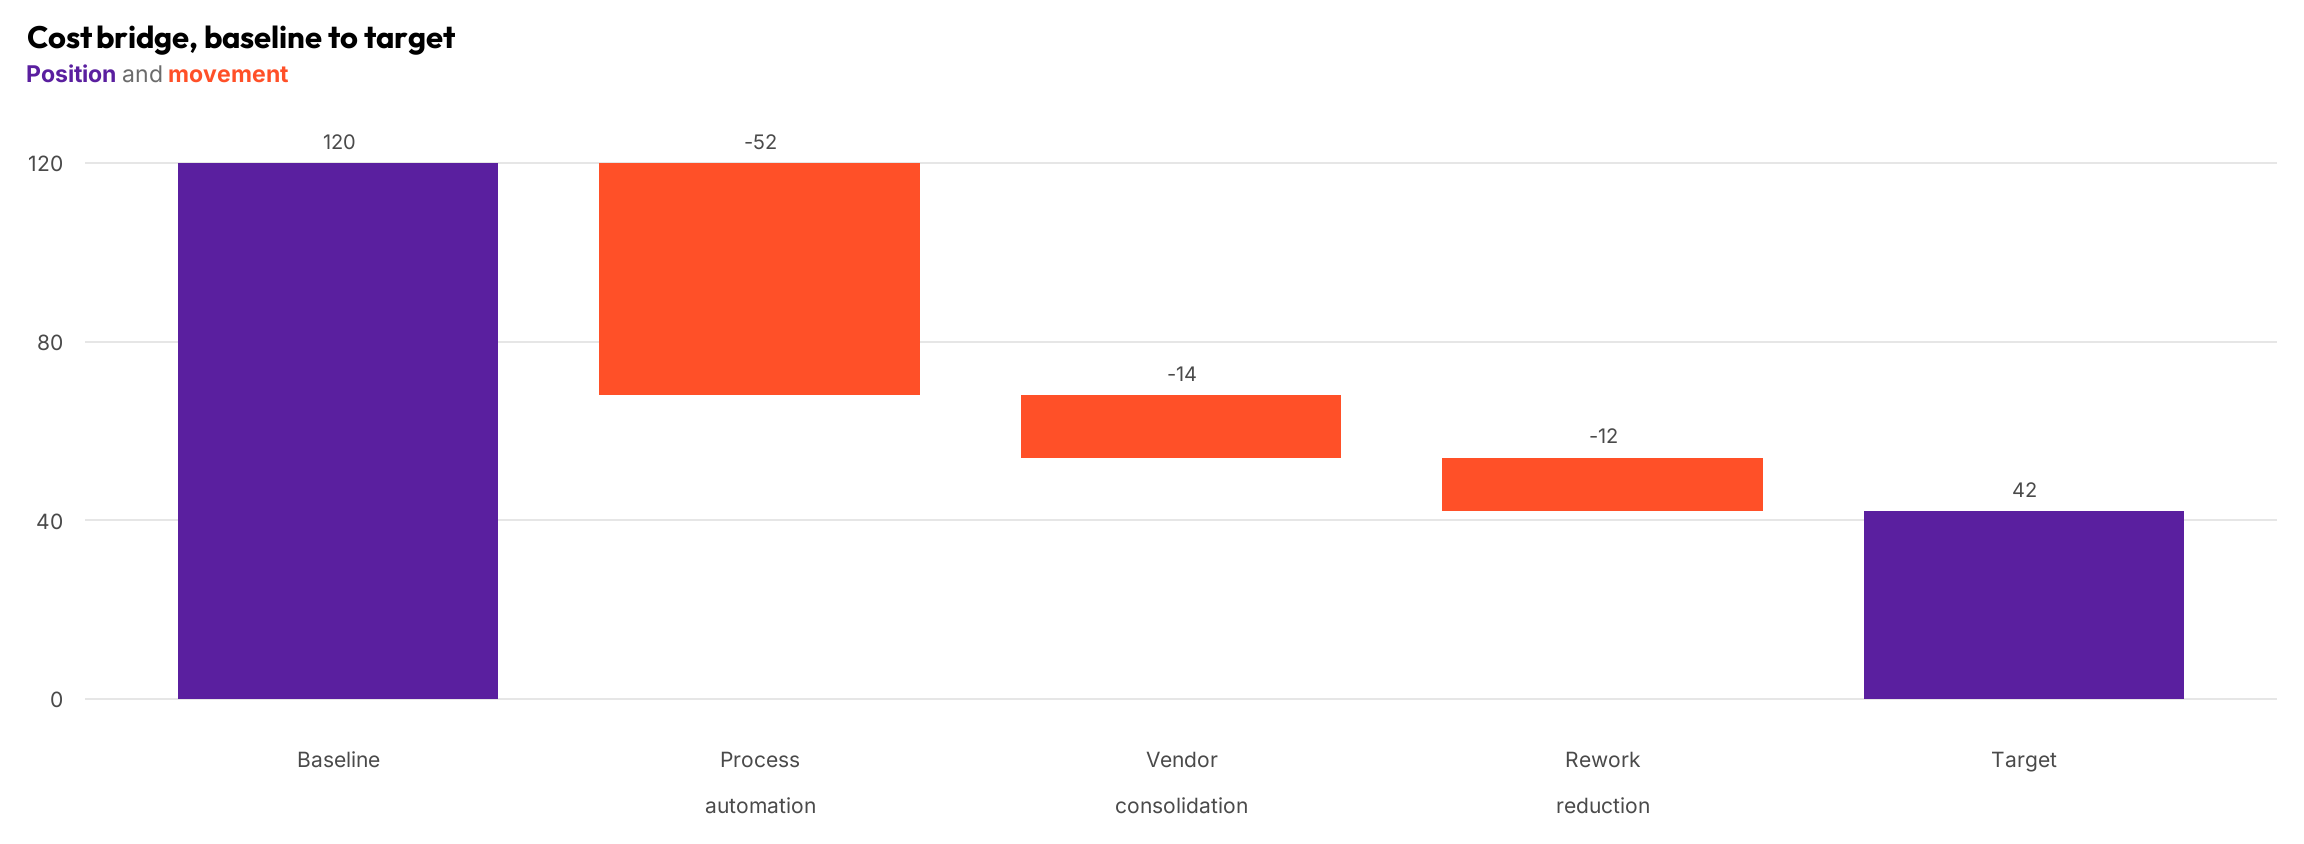
€ millions, annualised
Note: Figures rounded to the nearest million; totals may not sum. Source: Engagement model v4
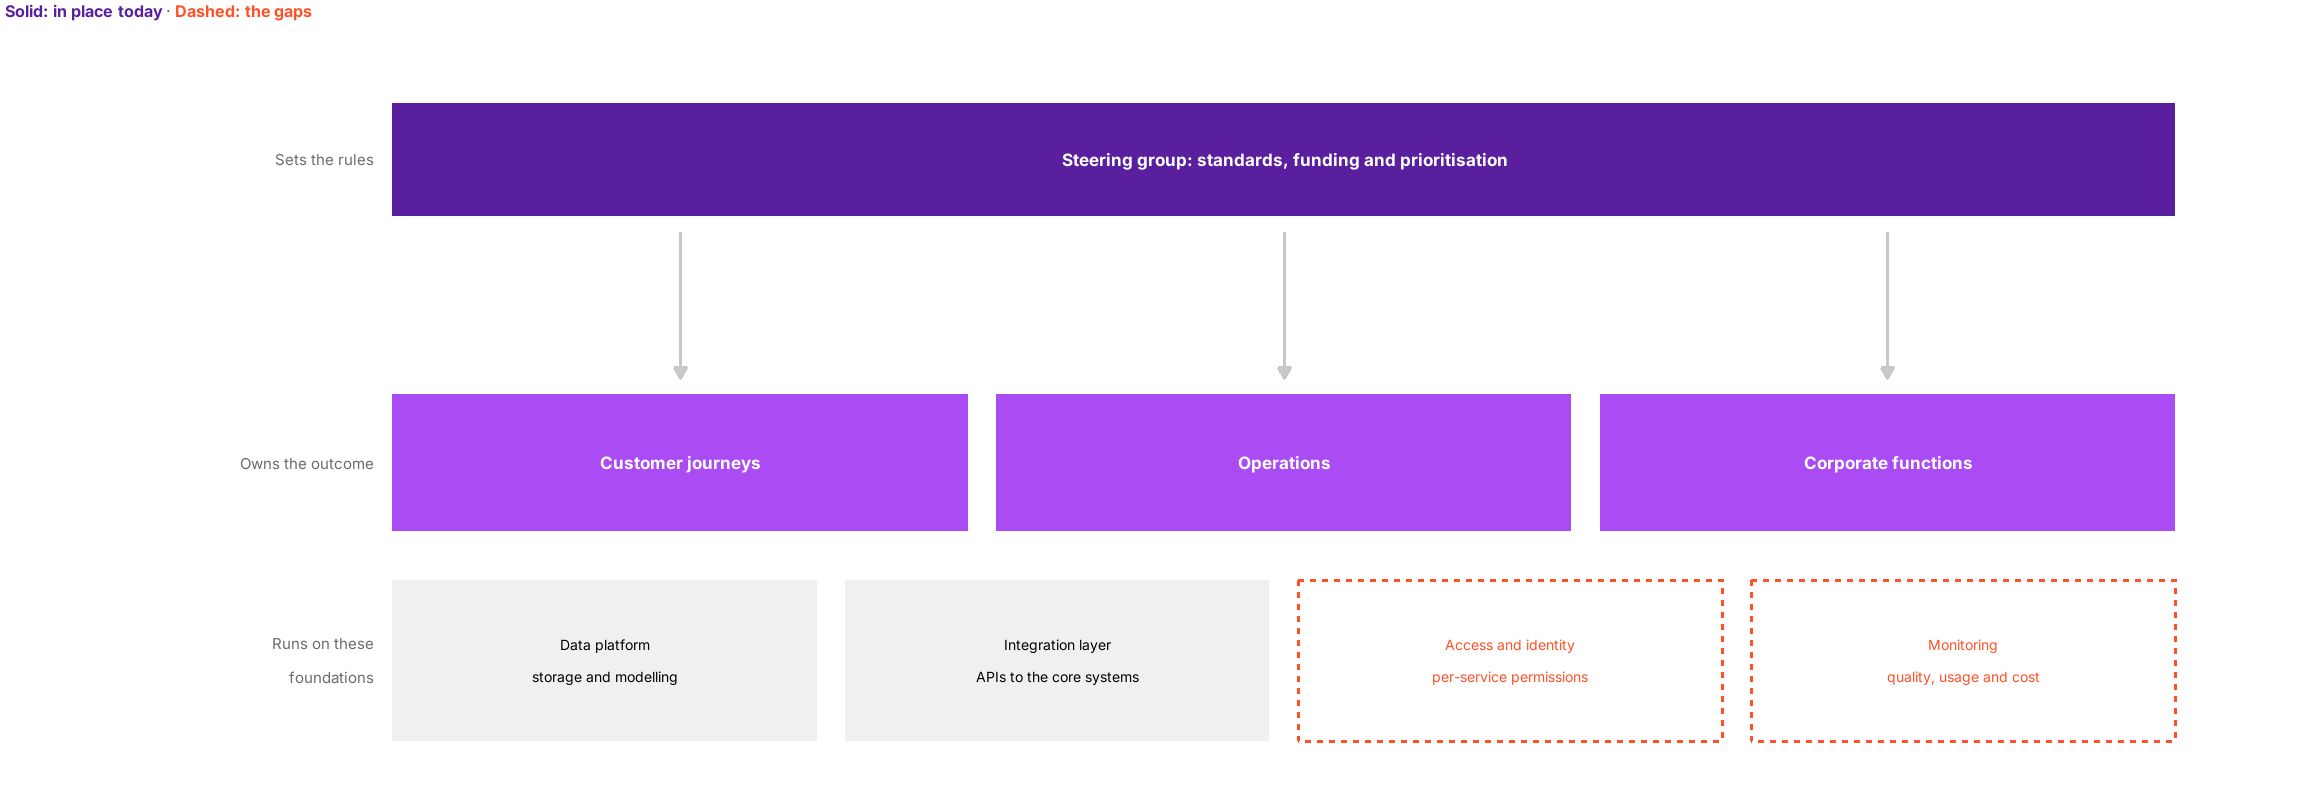
Note: Dashed boxes are capabilities that do not exist yet, not ones that exist and underperform.

The decision this deck asks for is the six-week pilot, not the platform.
Syntax that earns its place:
## Kicker then ### Action title::: {.stats} with [42]{.figure} [Label]{.label}::: {.takeaway} for the bold lead-in::: {.units} under a chart::: {.source} for the bottom rail[text]{.chip} and [text]{.chip .accent}Per-slide attributes:
{background-color="#5A1F9F"} — statement slide{background-image="assets/swirl-dark.jpg"} — divider{.smaller} / {.scrollable} — dense slides{visibility="uncounted"} — appendix{visibility="hidden"} — parkedNexer purple Highlight

Nexer Insight