03 Coordinate systems and axes
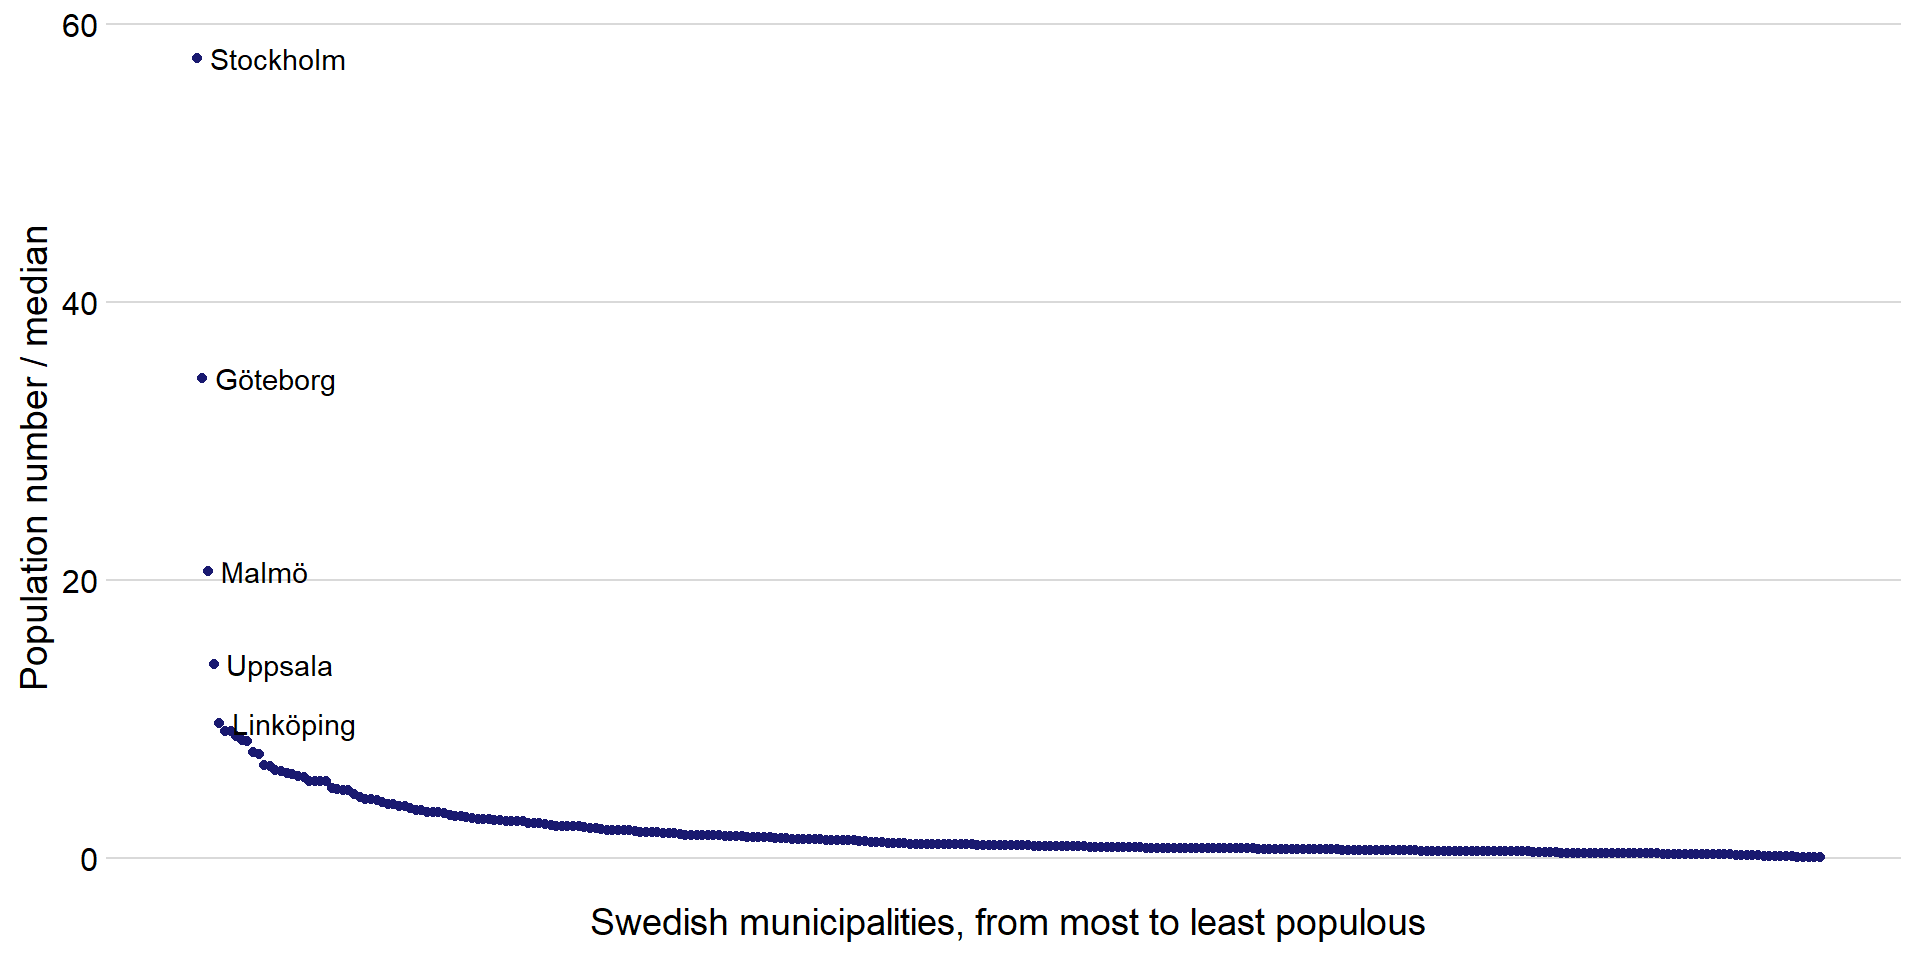
Example: Population of Swedish municipalities
A linear scale emphasizes large counties
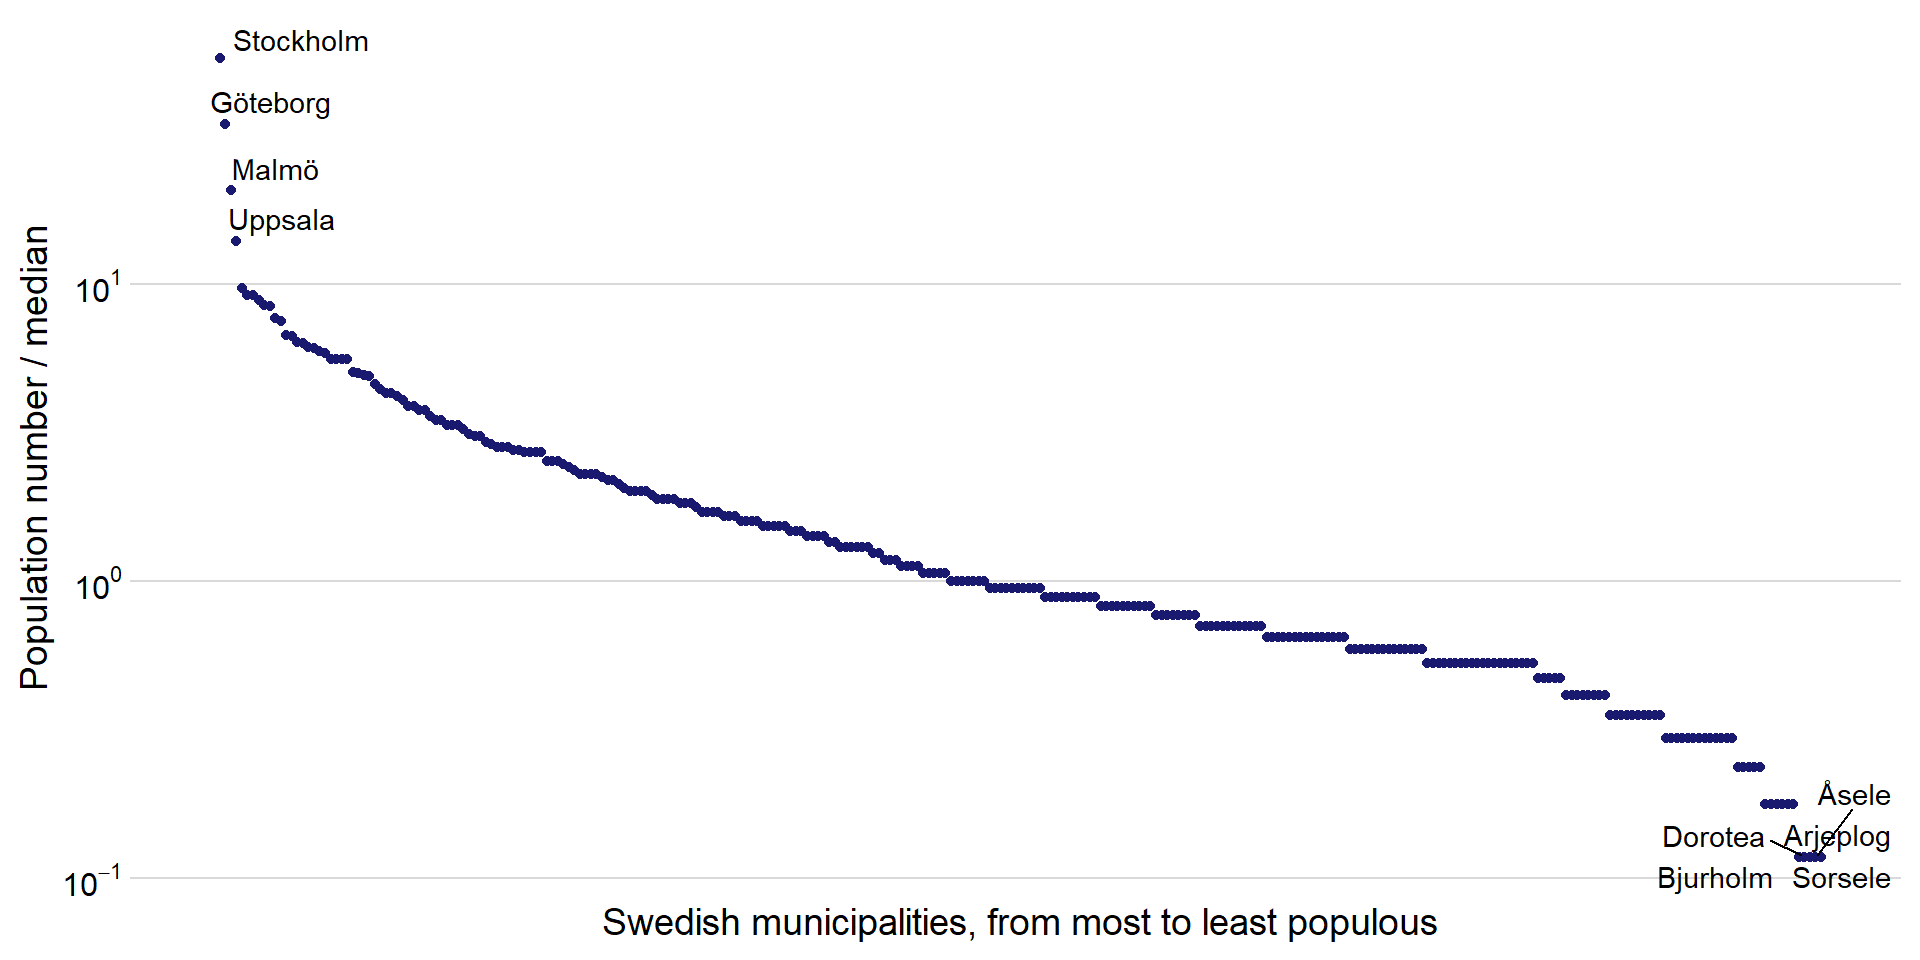
Example: Population of Swedish municipalities
A log scale shows symmetry around the median
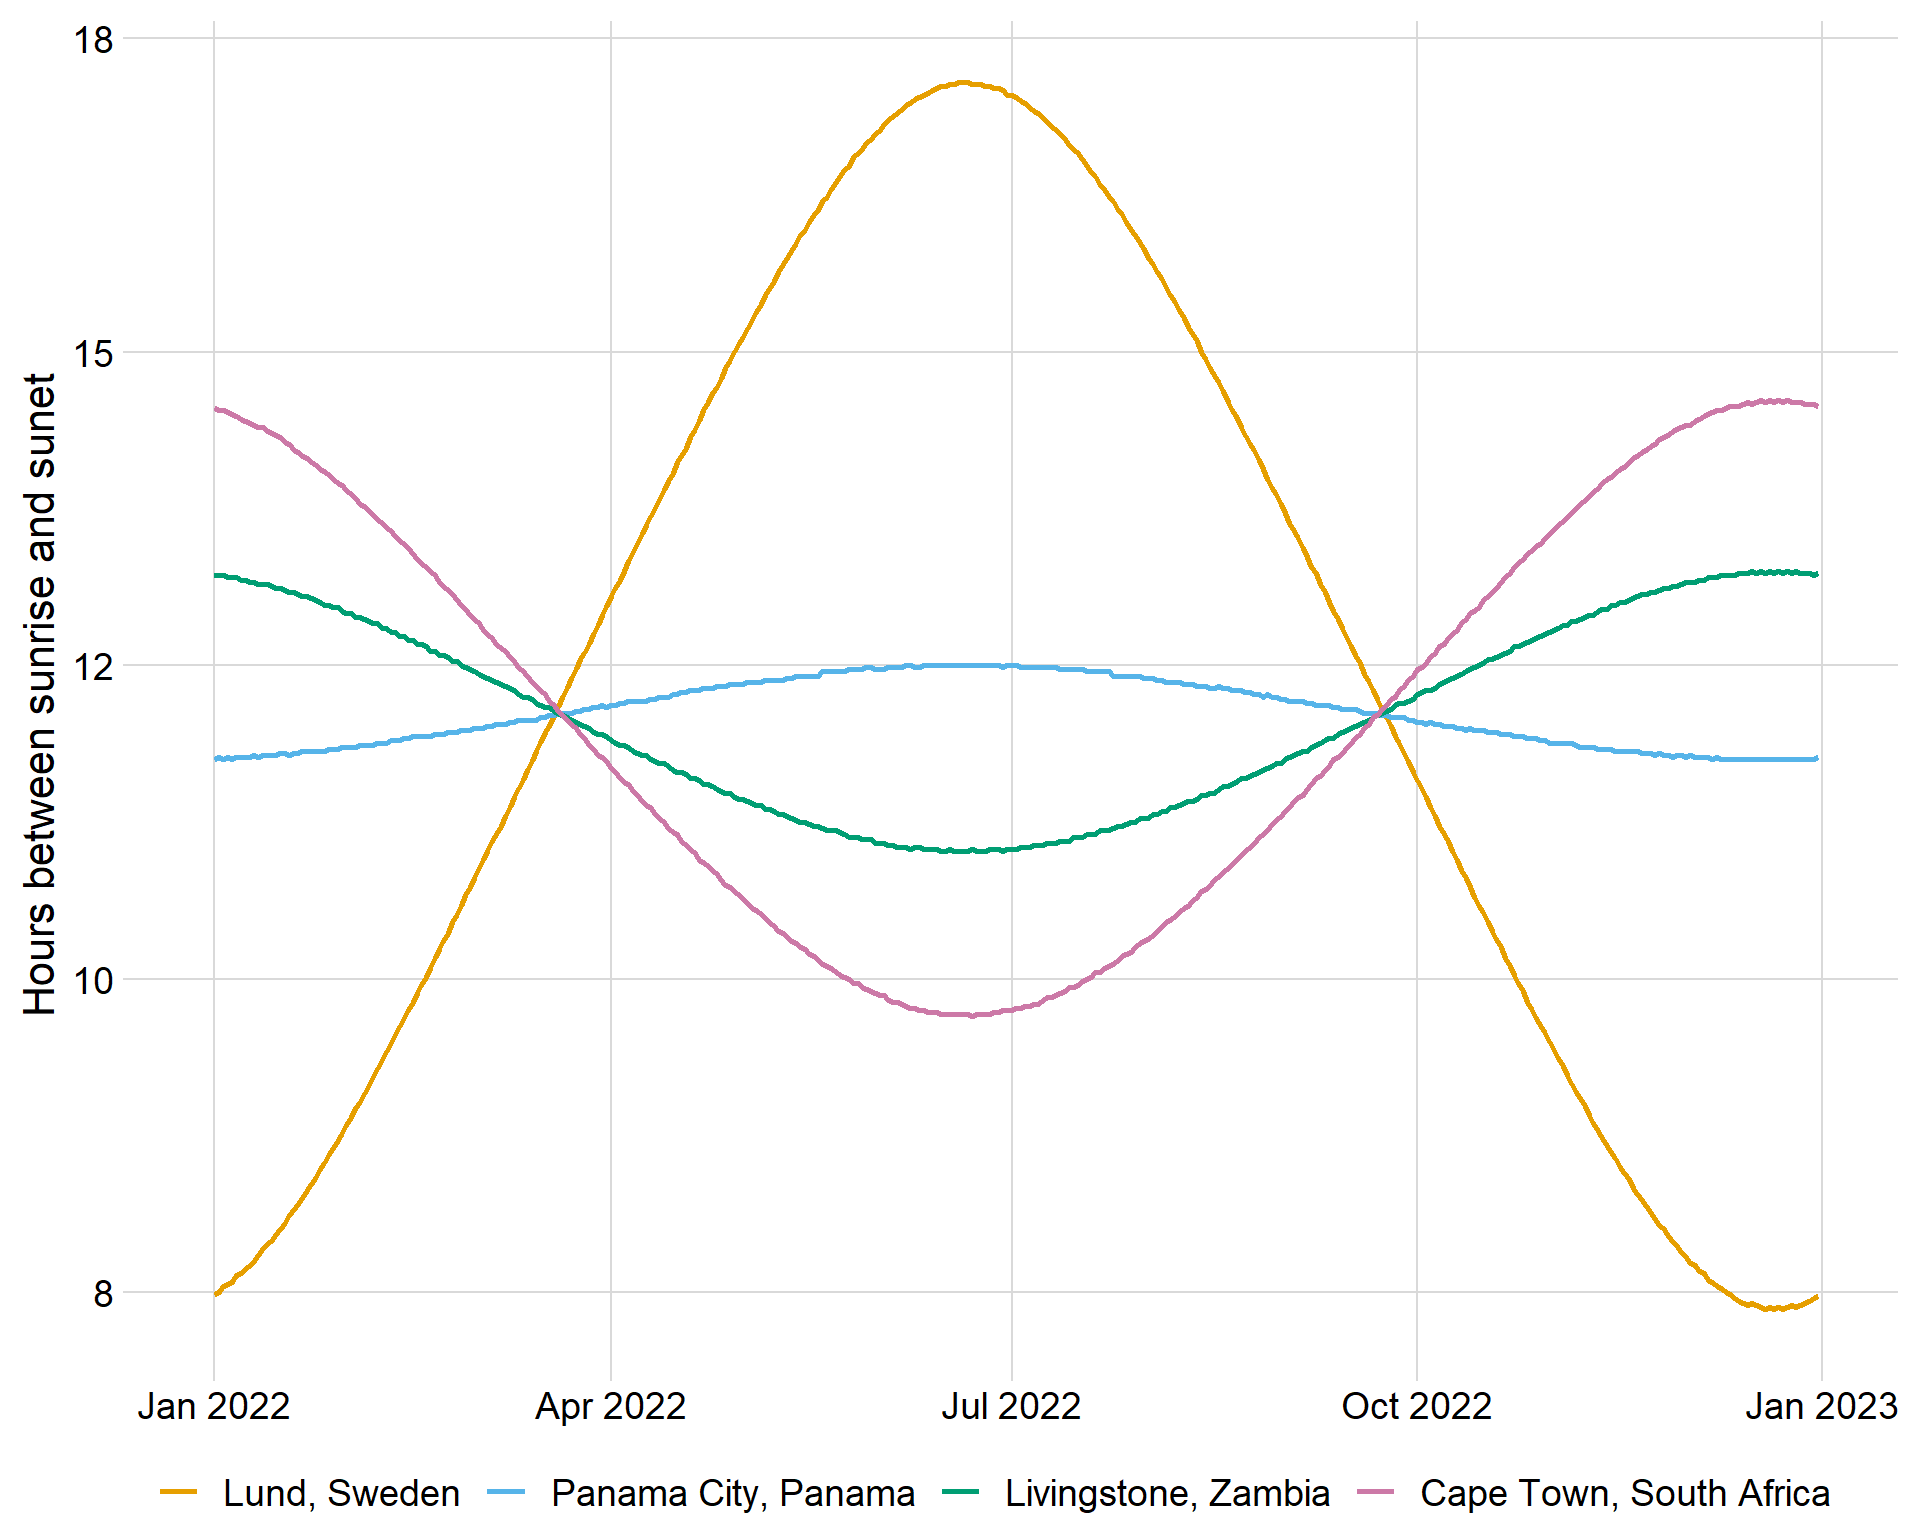
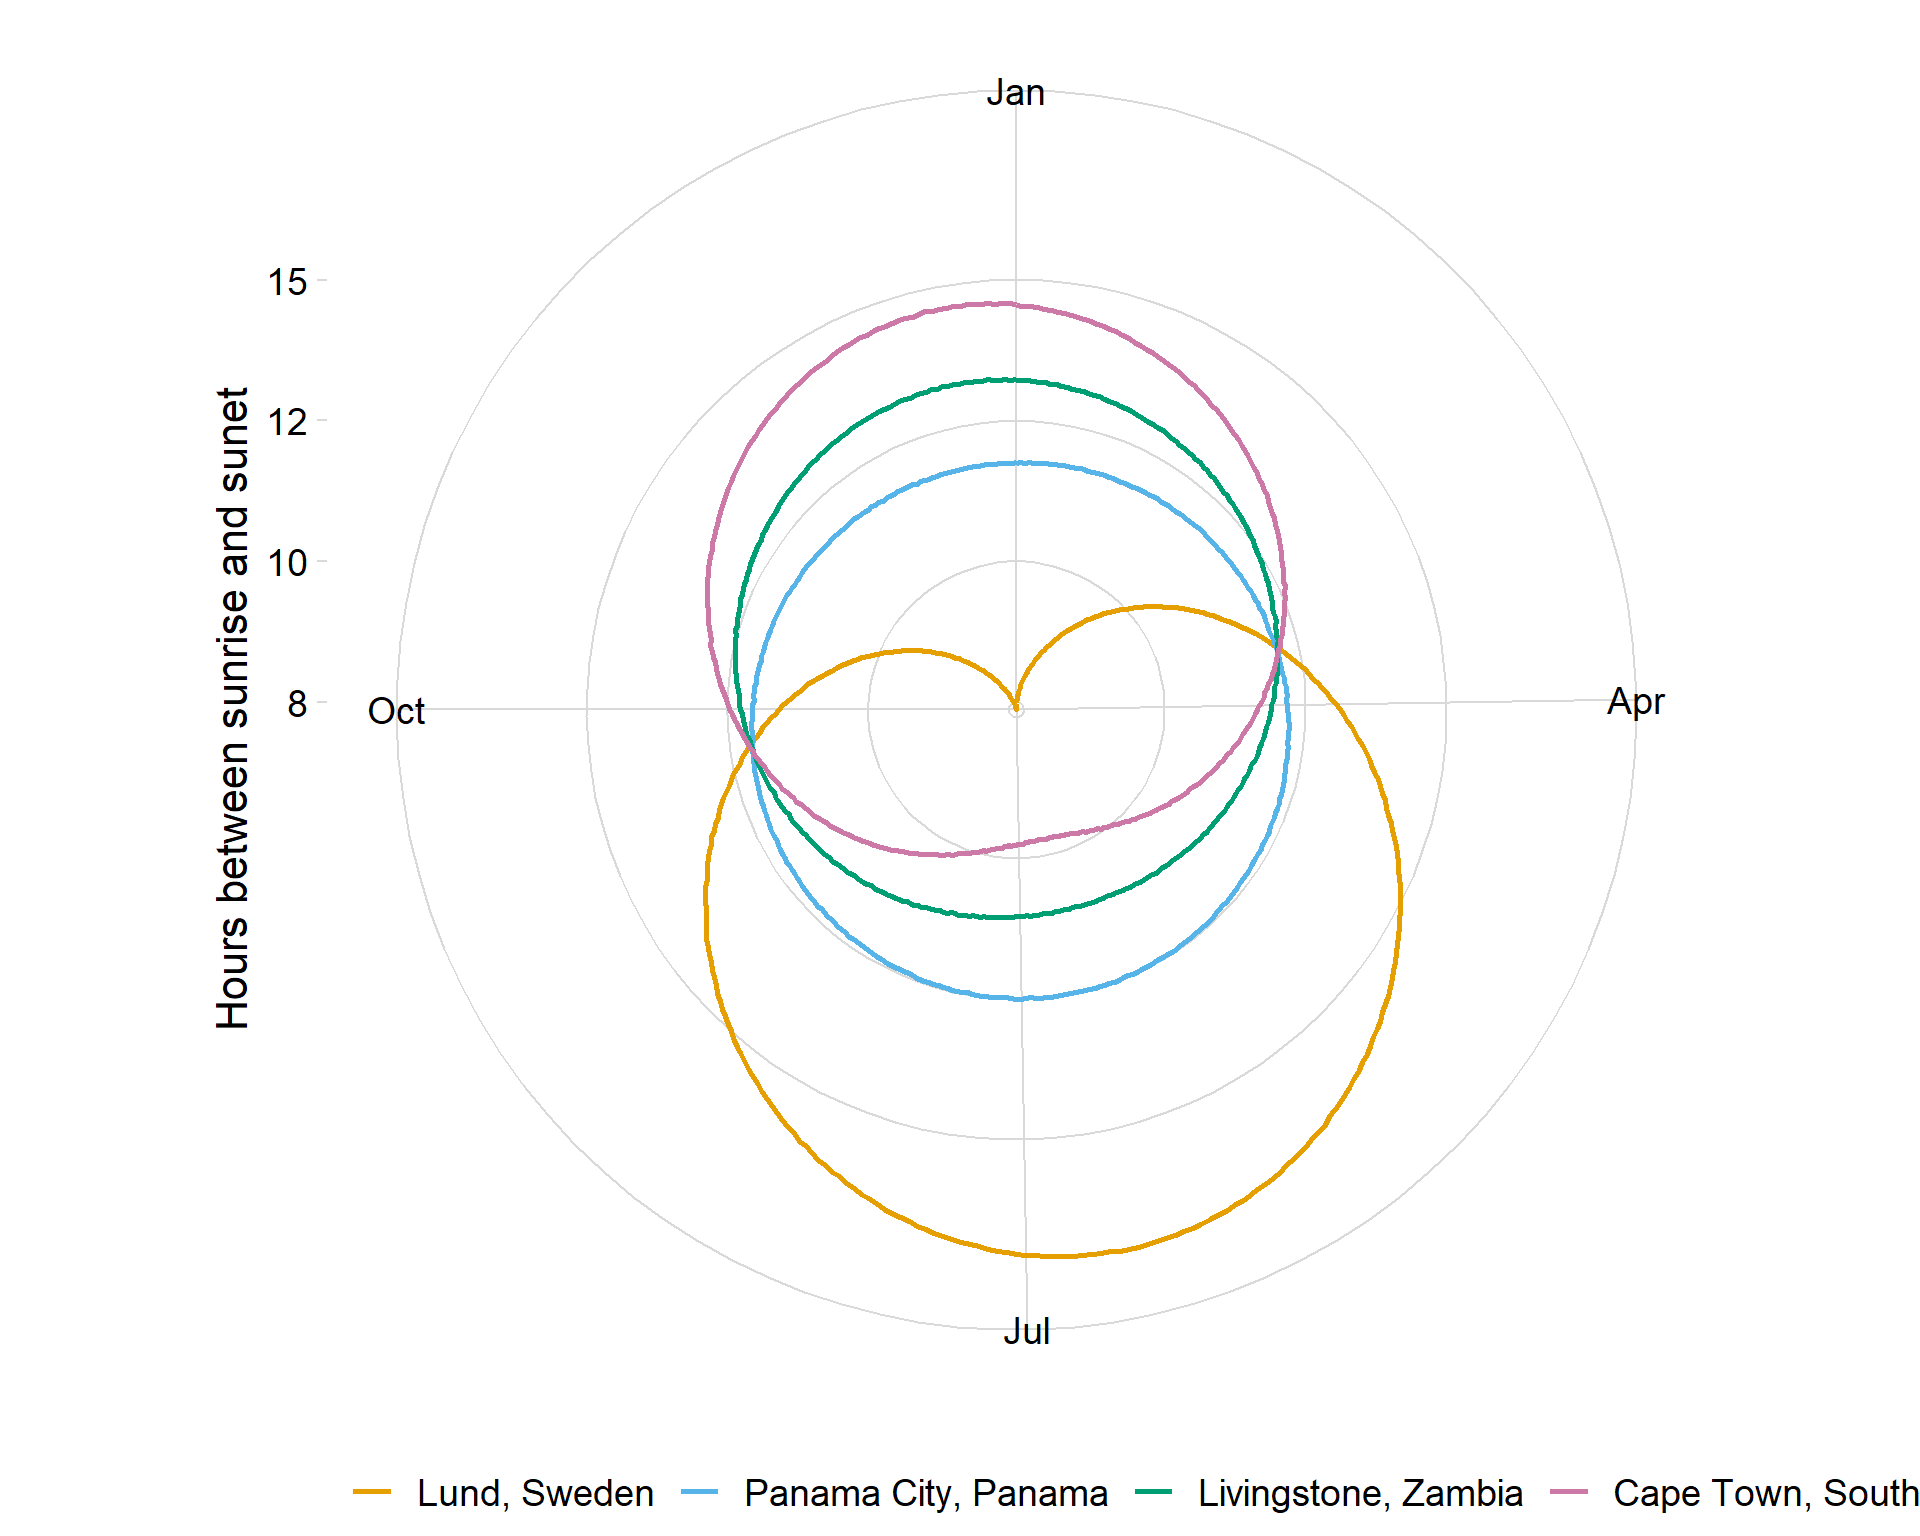
Nonlinear coordinate systems: Polar coordinates
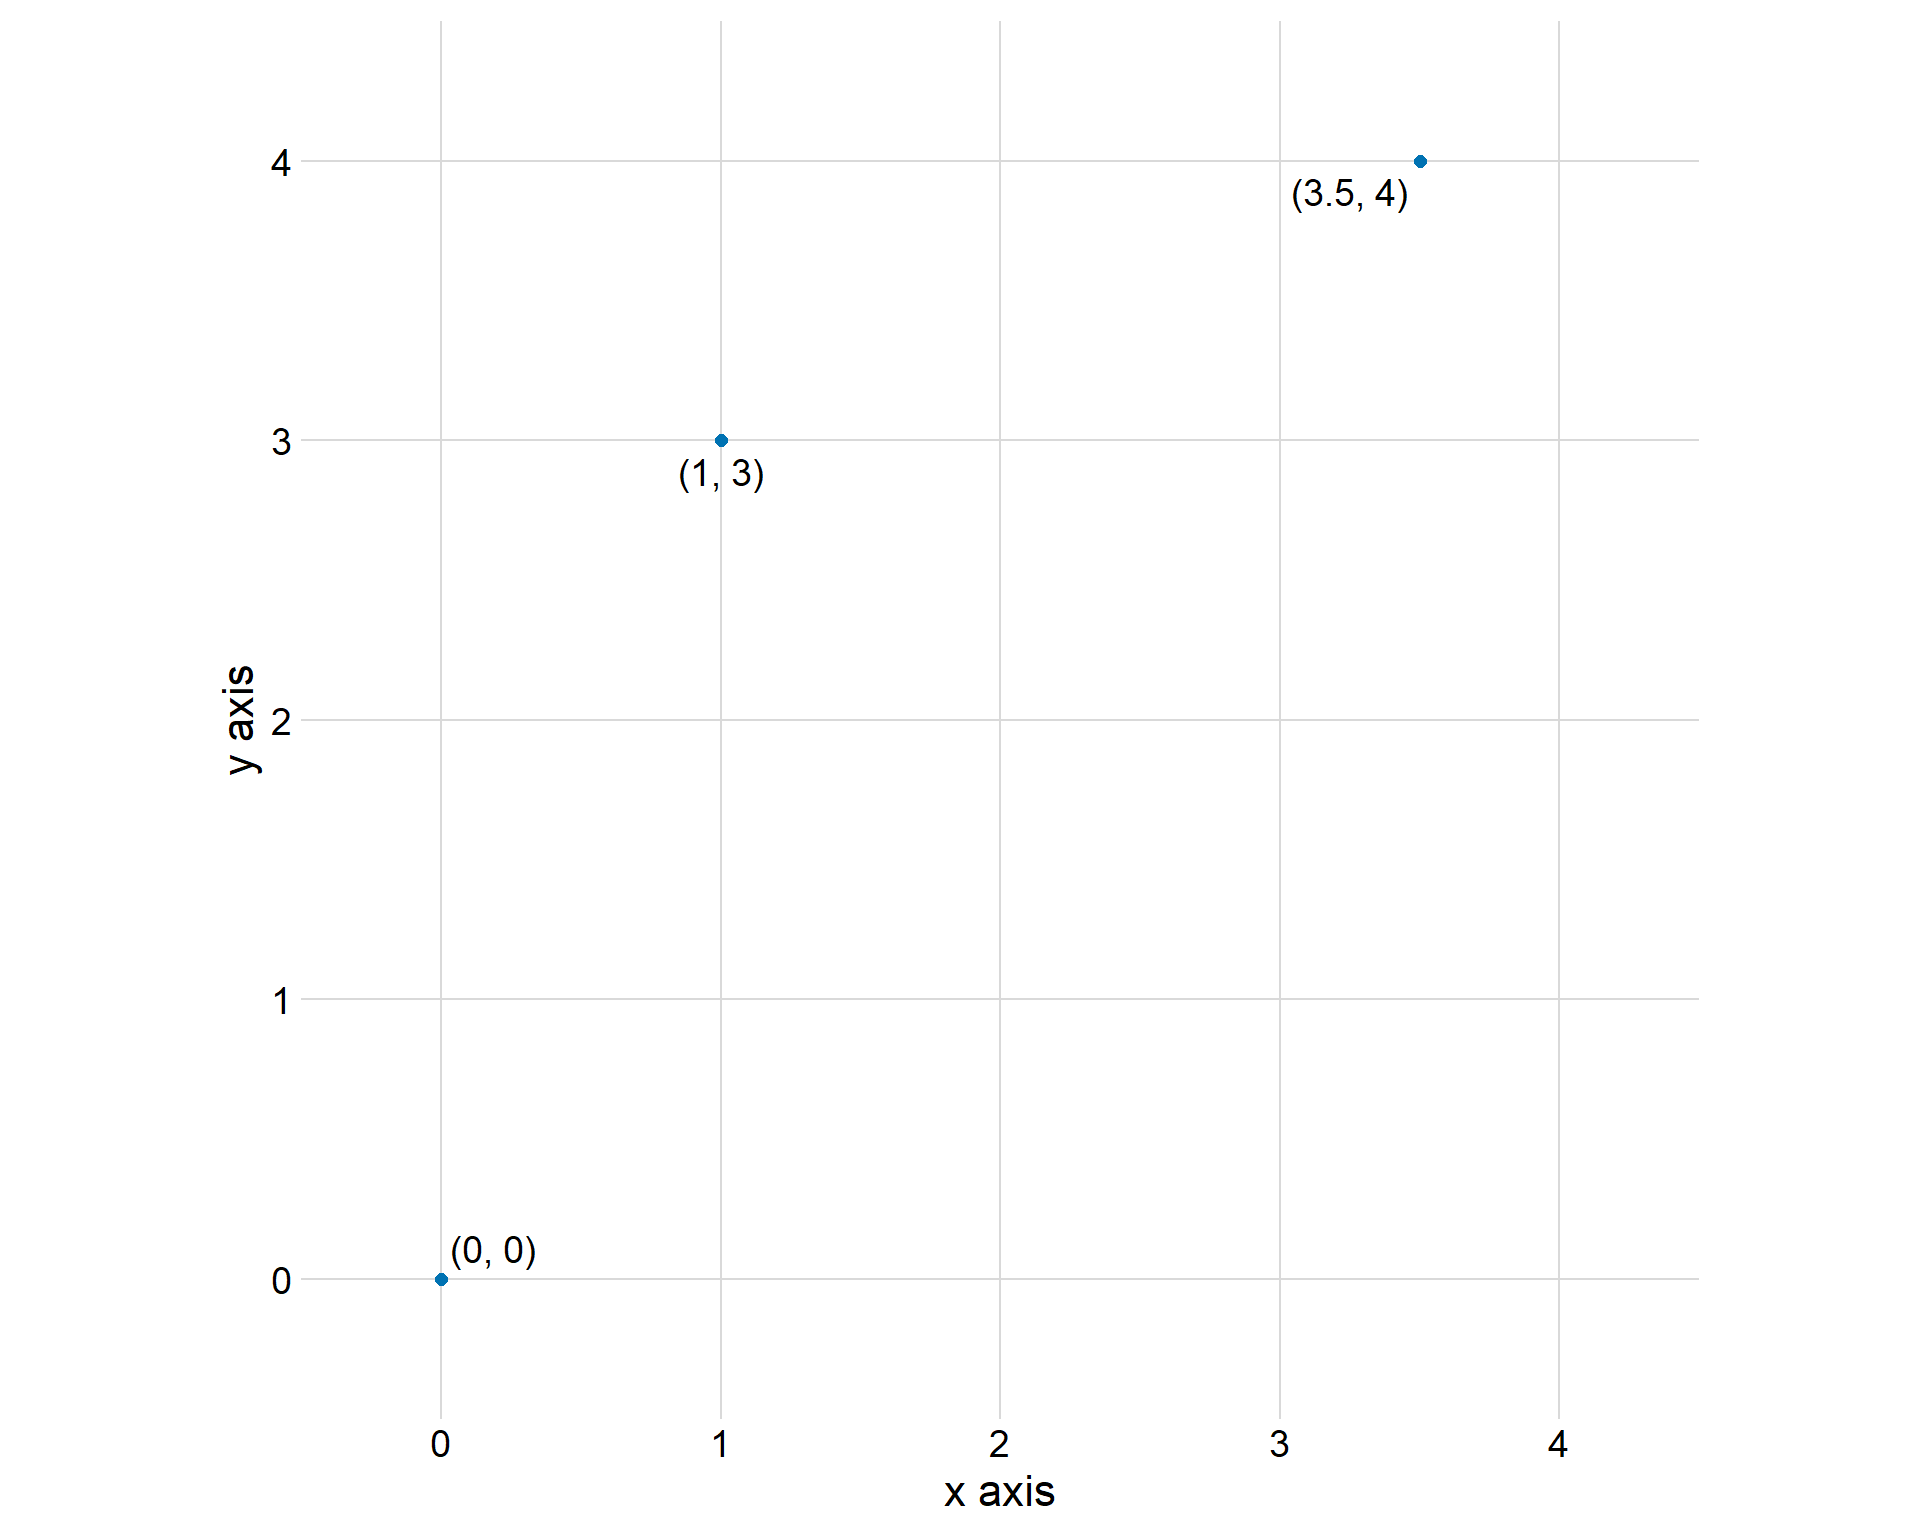
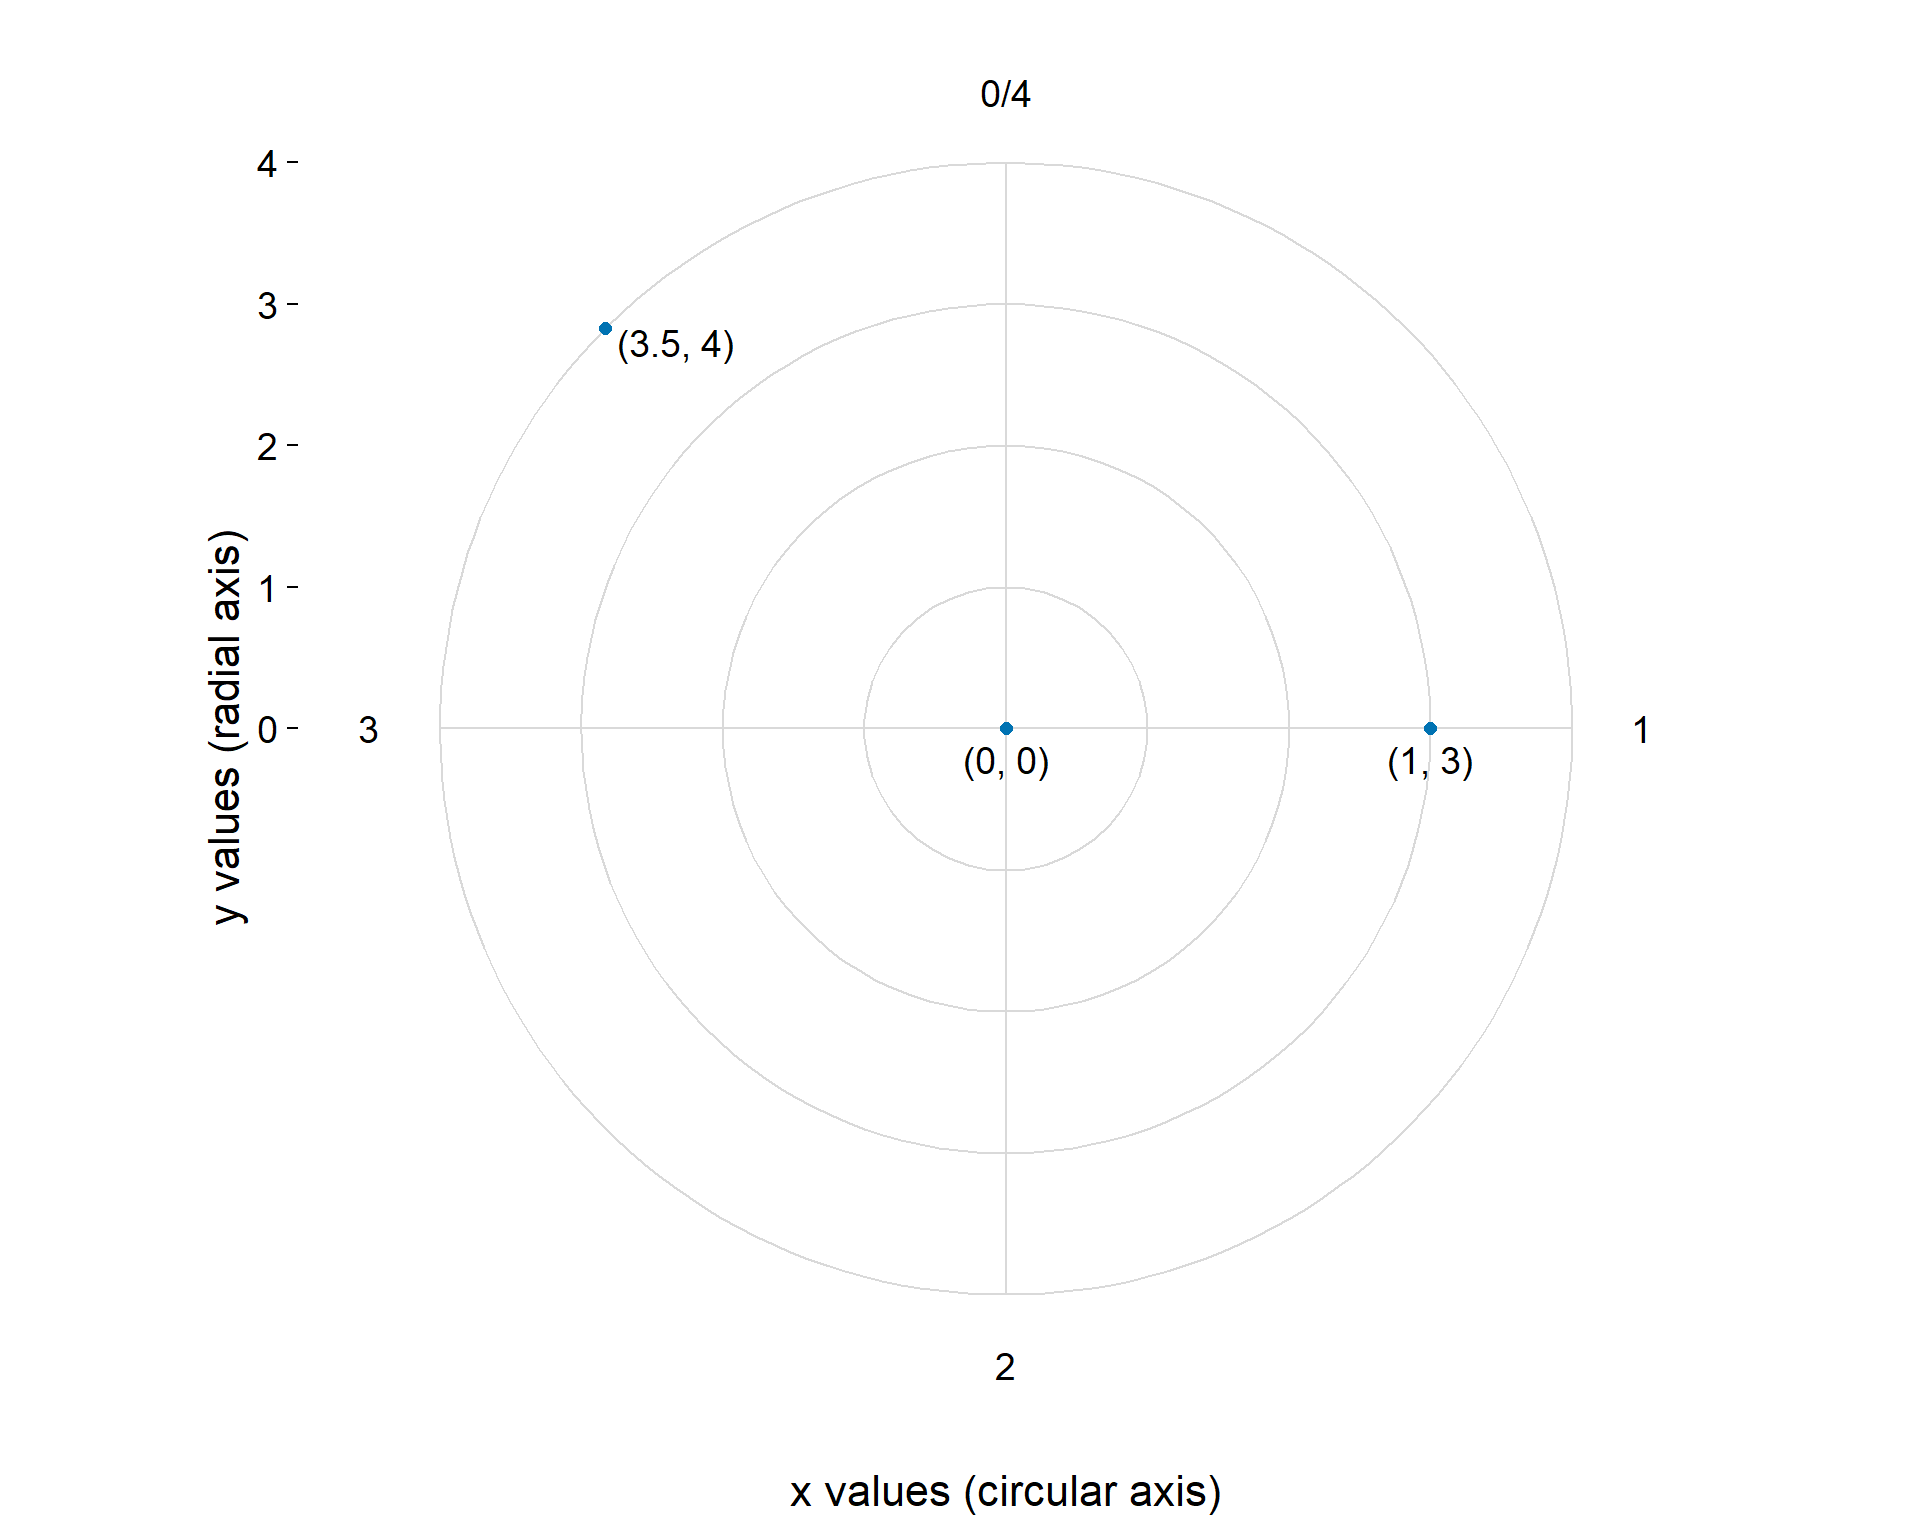
Cartesian vs polar coordinates
Scale functions customize the x and y axes
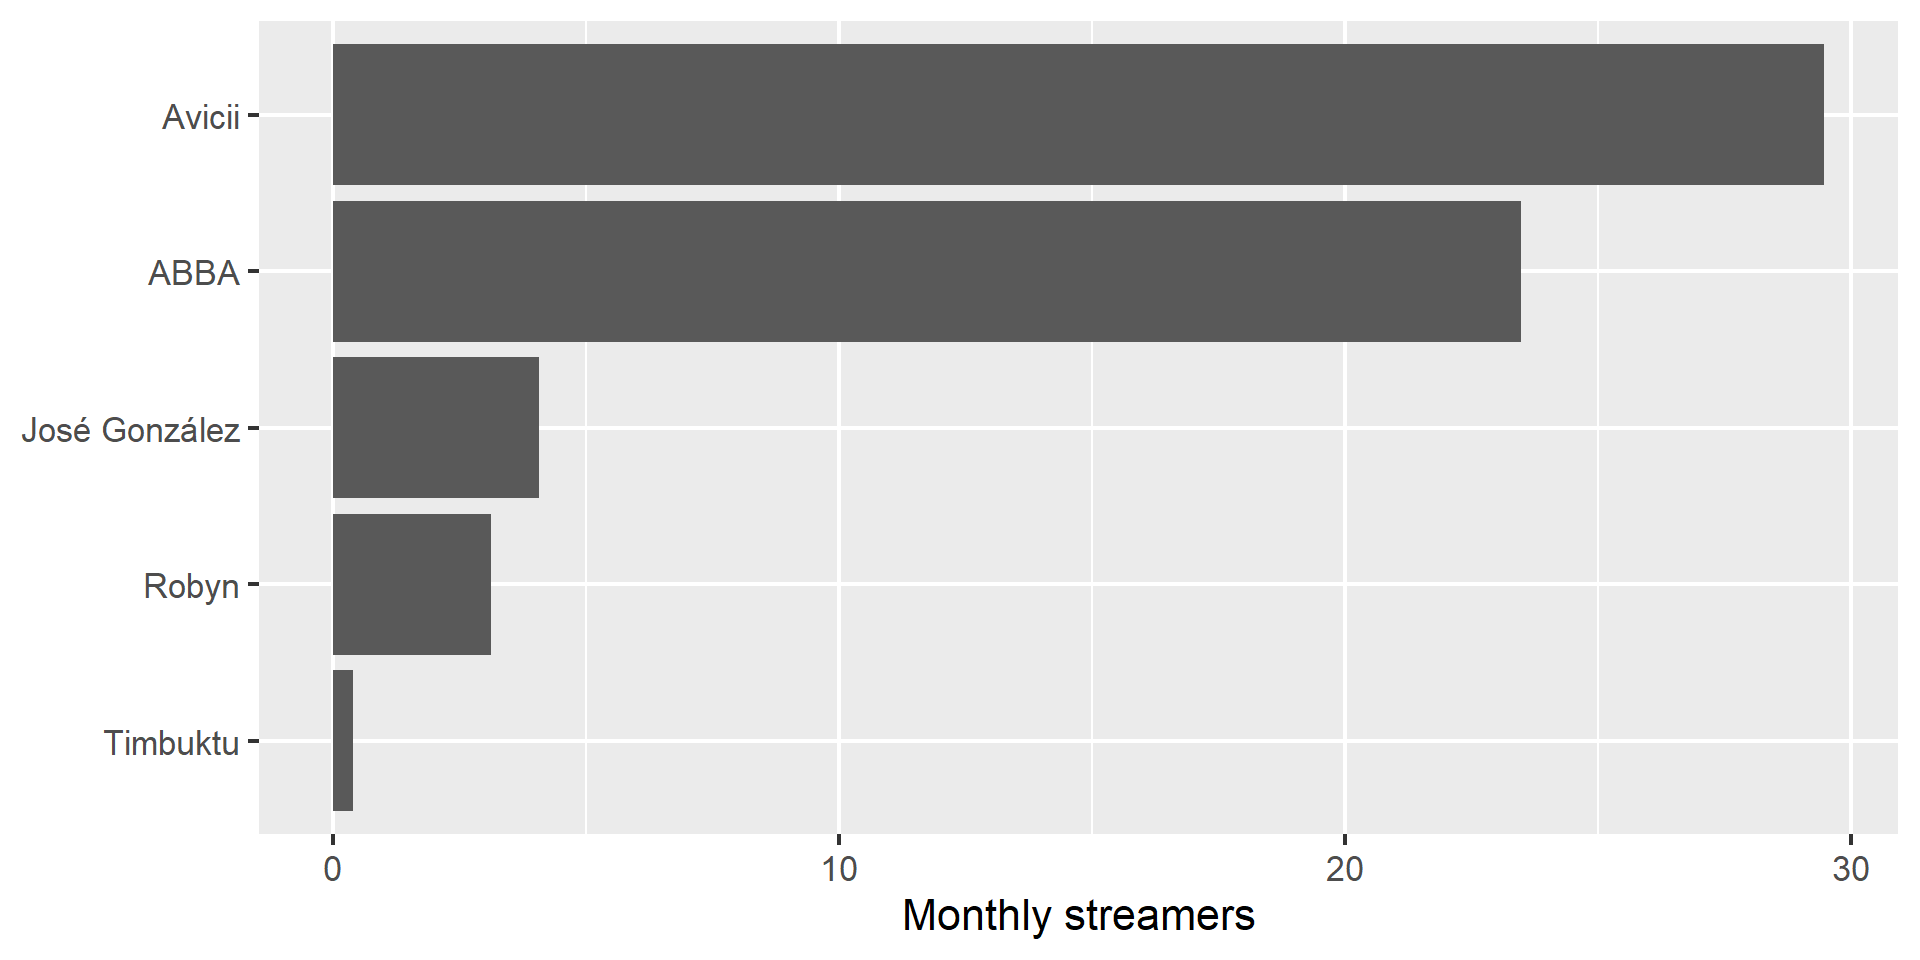
Recall the musical artists example from a prior lecture
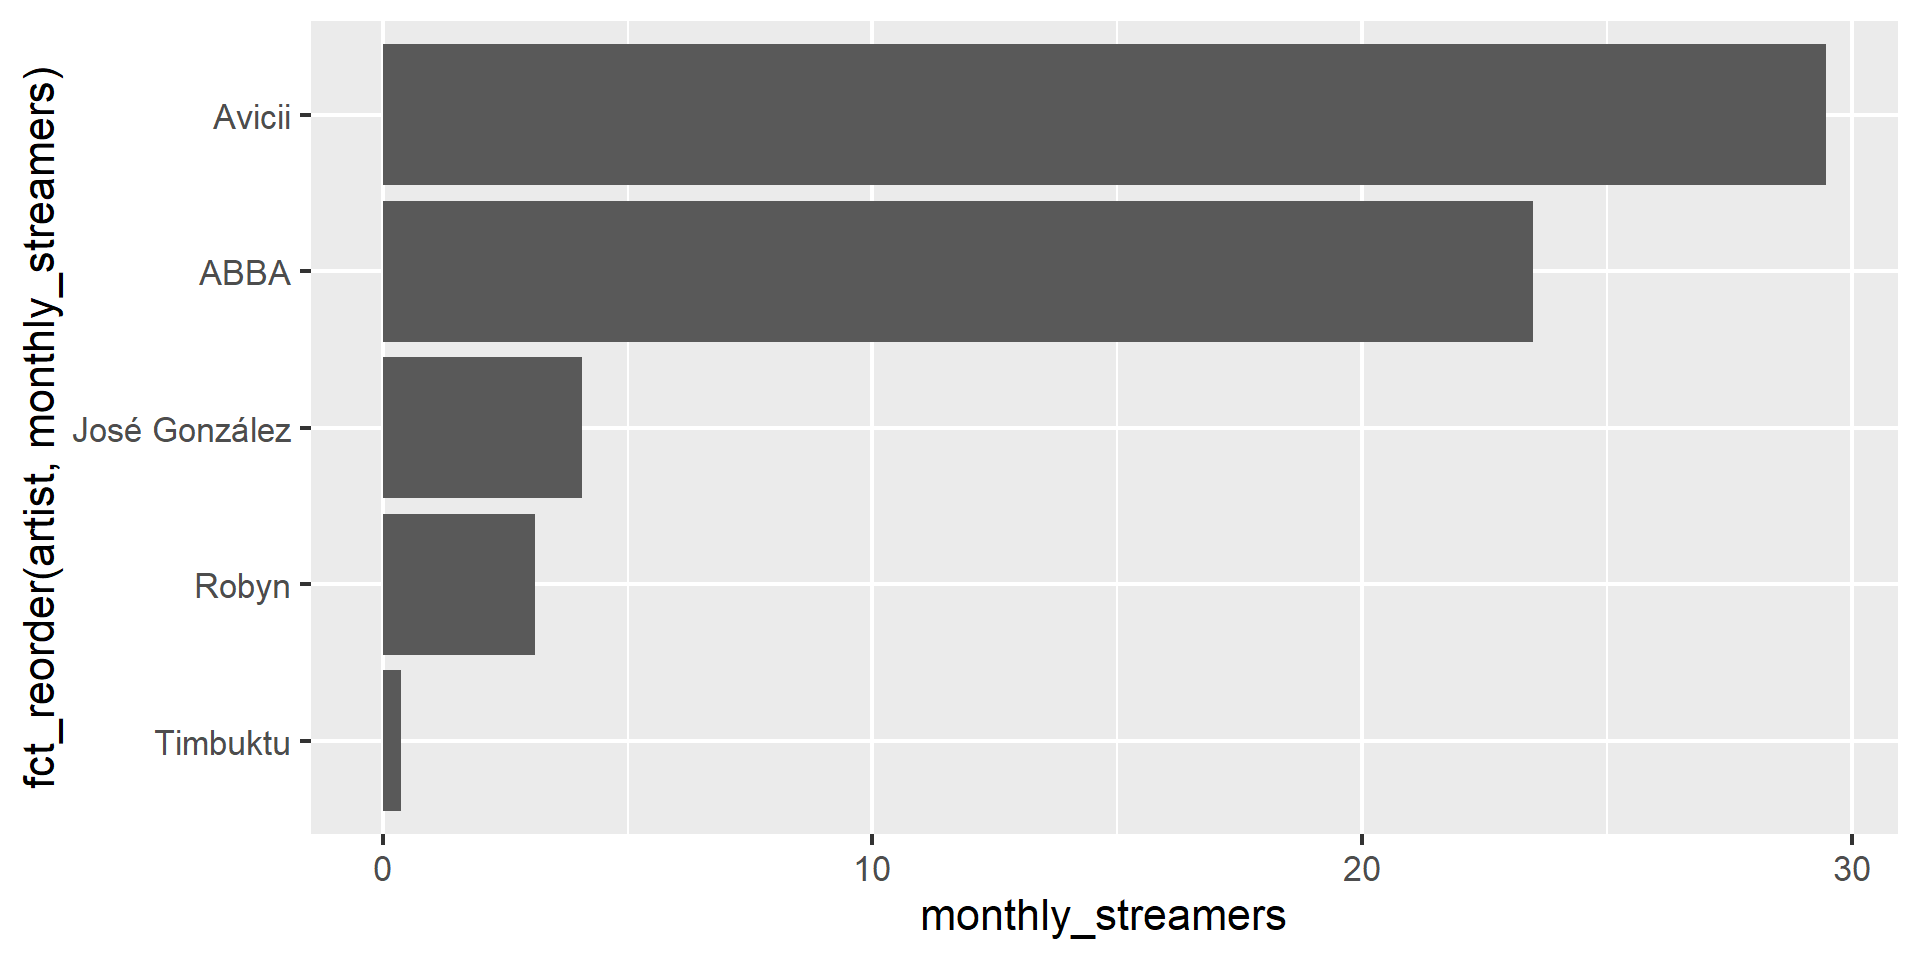
Scale functions customize the x and y axes
Add scale functions (no change in figure so far)

Scale functions customize the x and y axes
The parameter name sets the axis title