| Sunrise and sunset time | |||
| City | Date | Hours between sunrise and sunset | month |
|---|---|---|---|
| Cape Town, South Africa | 2022-01-01 | 14.55000 | Jan |
| Cape Town, South Africa | 2022-01-02 | 14.53333 | Jan |
| Cape Town, South Africa | 2022-01-03 | 14.53333 | Jan |
| Cape Town, South Africa | 2022-01-04 | 14.51667 | Jan |
| Cape Town, South Africa | 2022-01-05 | 14.50000 | Jan |
| Cape Town, South Africa | 2022-01-06 | 14.48333 | Jan |
| Cape Town, South Africa | 2022-01-07 | 14.46667 | Jan |
| Cape Town, South Africa | 2022-01-08 | 14.45000 | Jan |
| Cape Town, South Africa | 2022-01-09 | 14.43333 | Jan |
| Cape Town, South Africa | 2022-01-10 | 14.41667 | Jan |
| Source: Schools observatory | |||
01 Aesthetic mappings
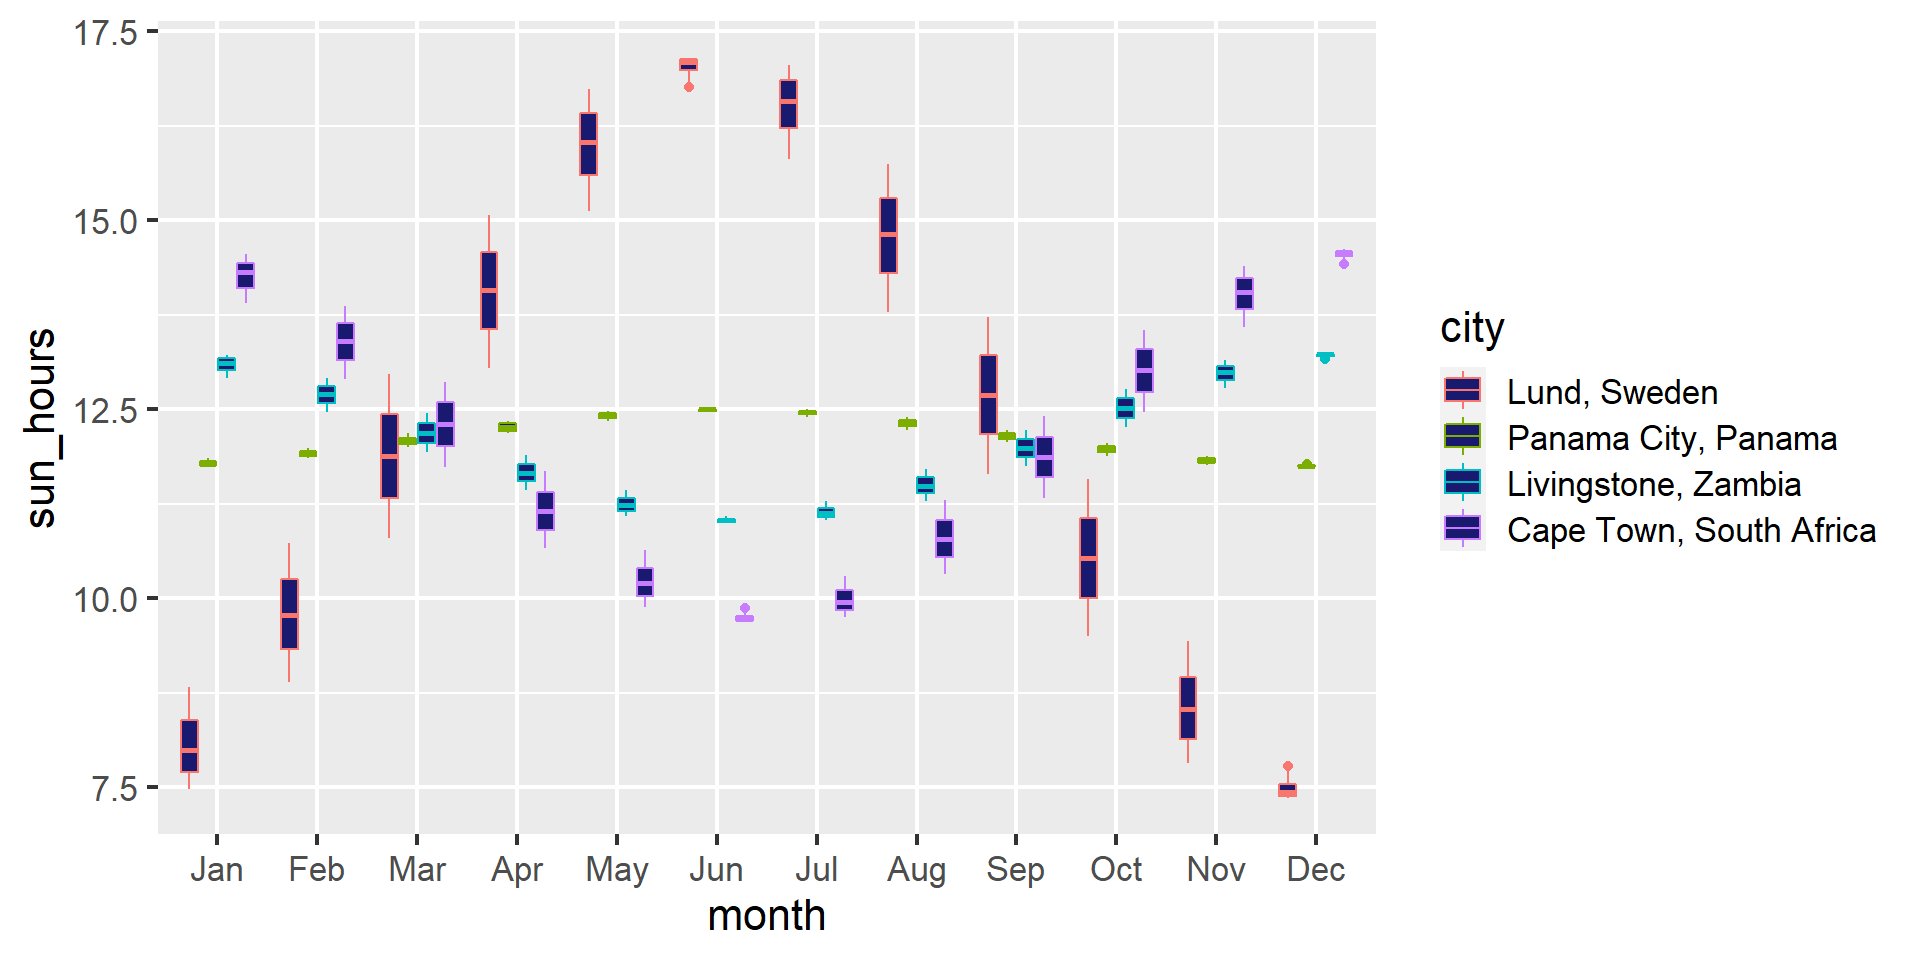
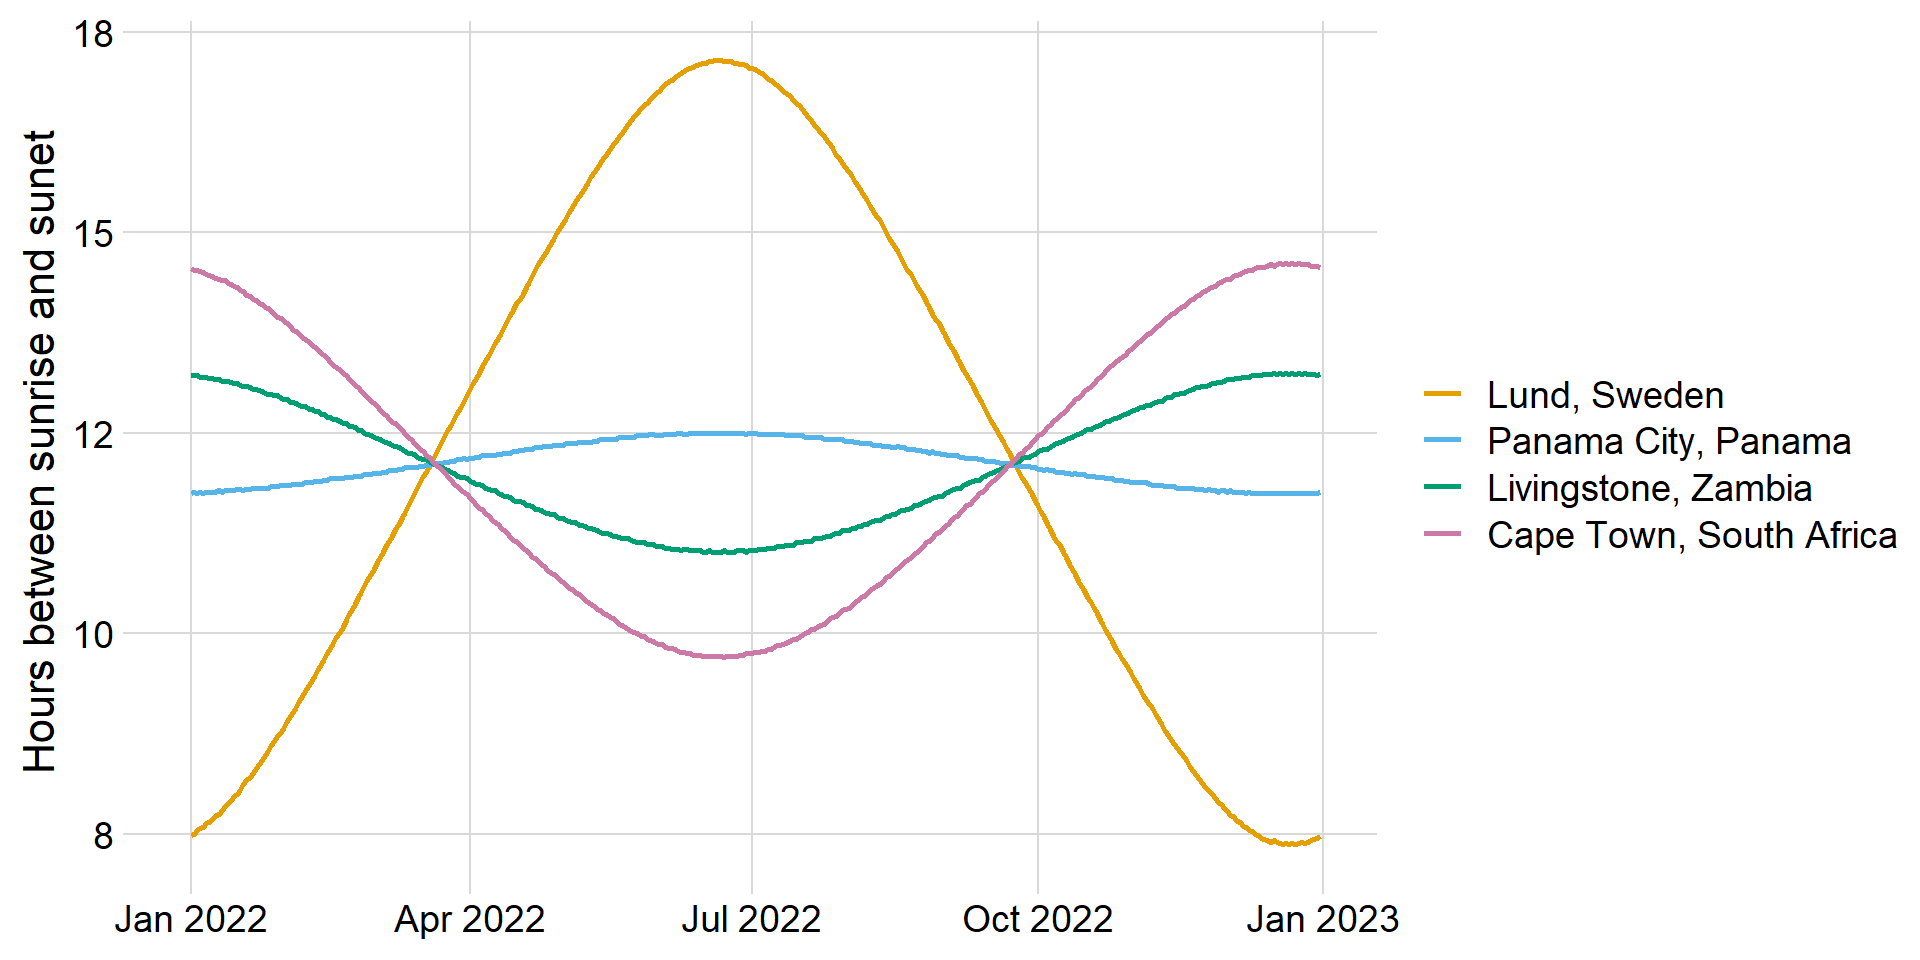
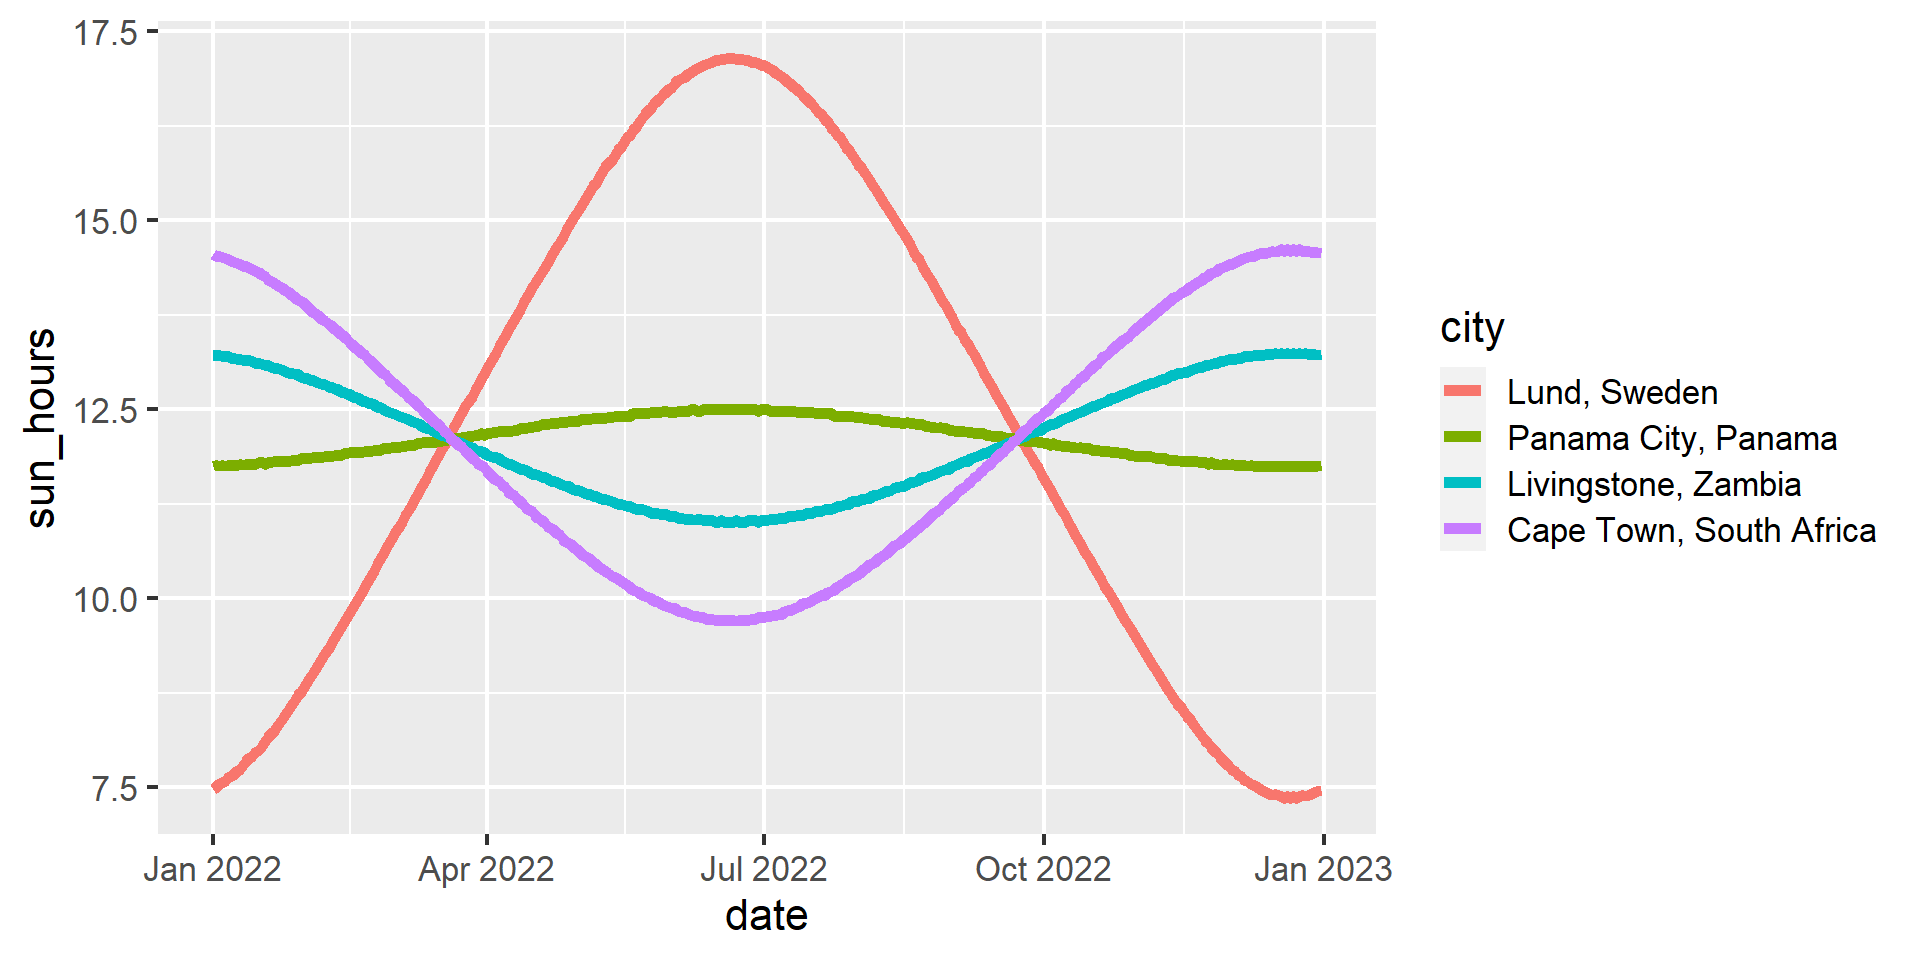
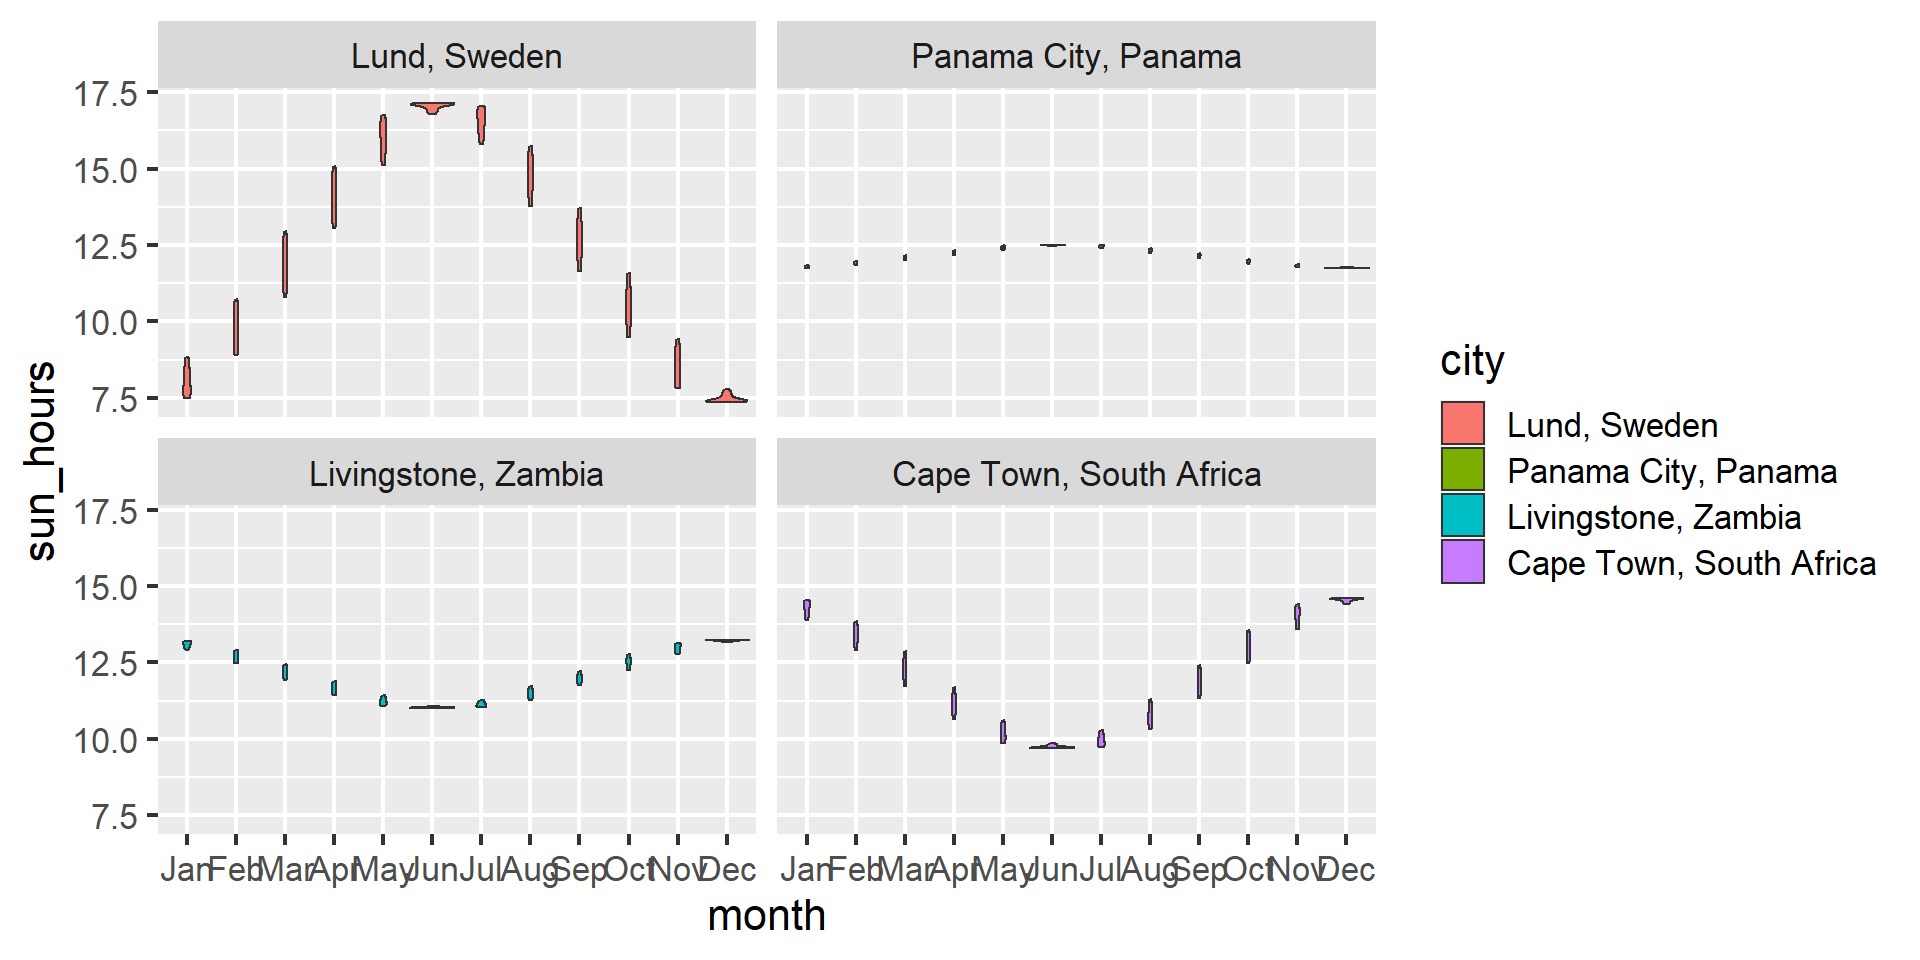
Sun hours mapped onto y position
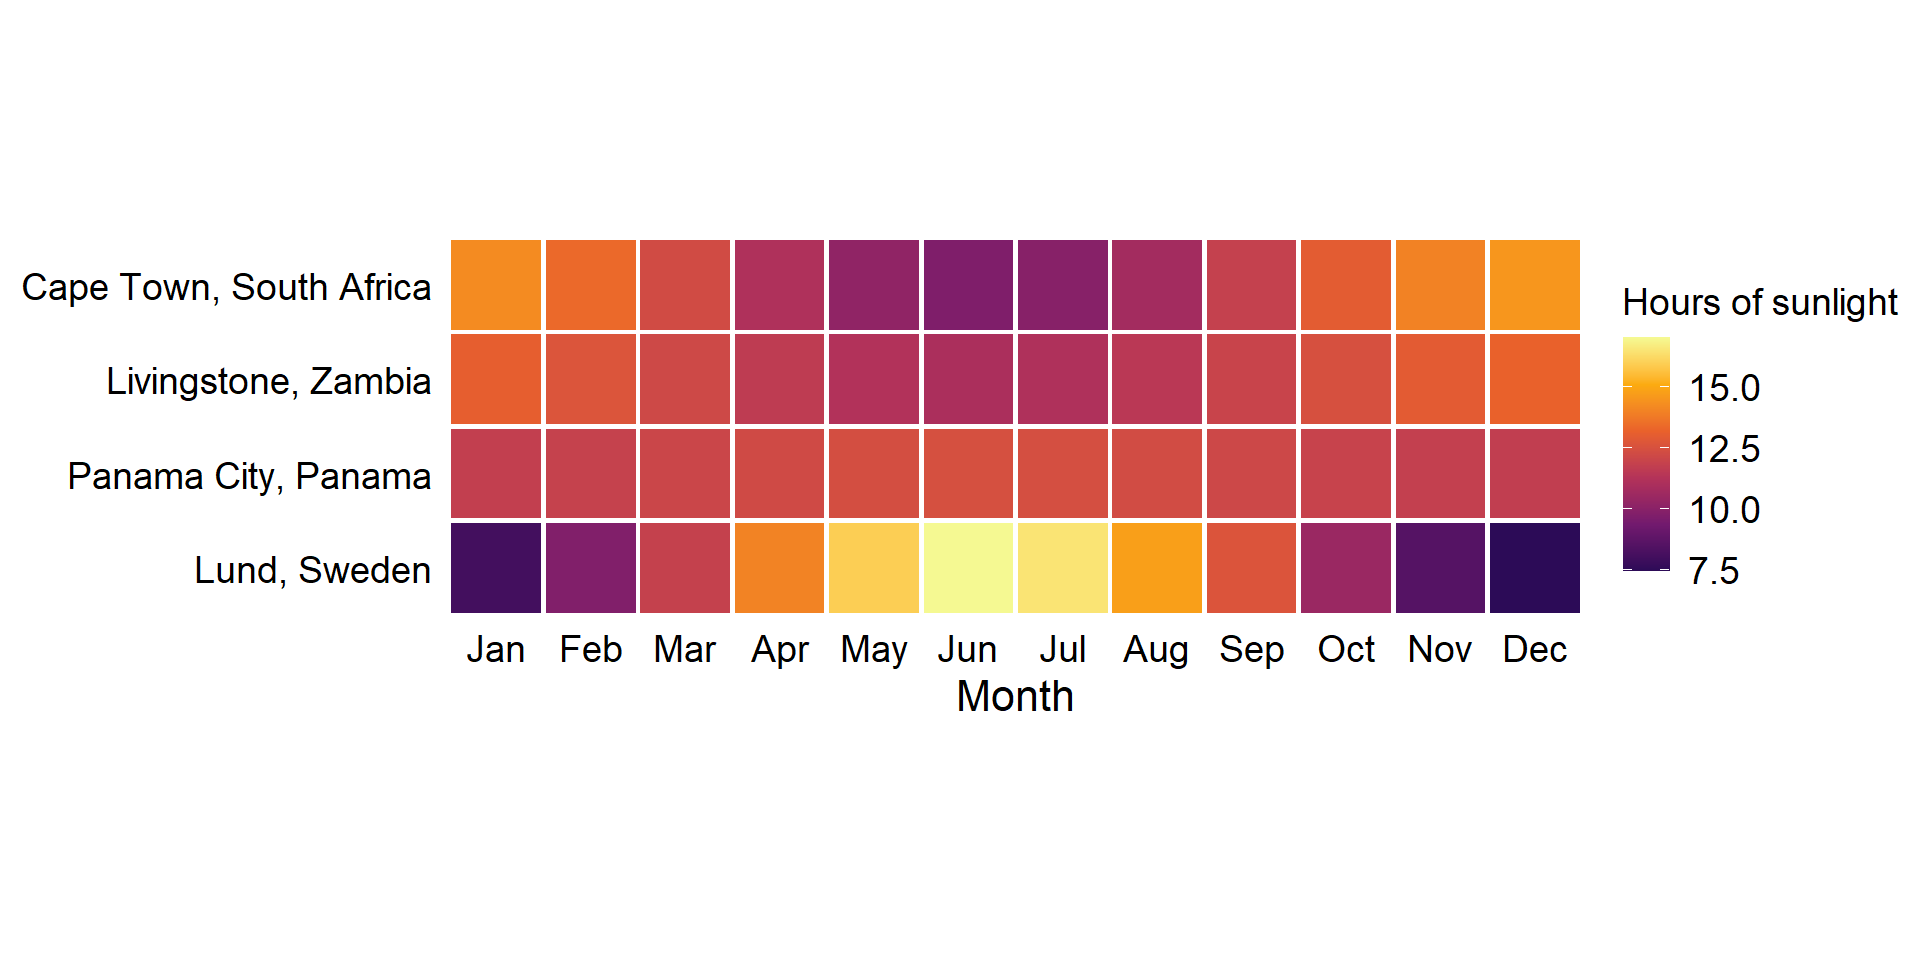
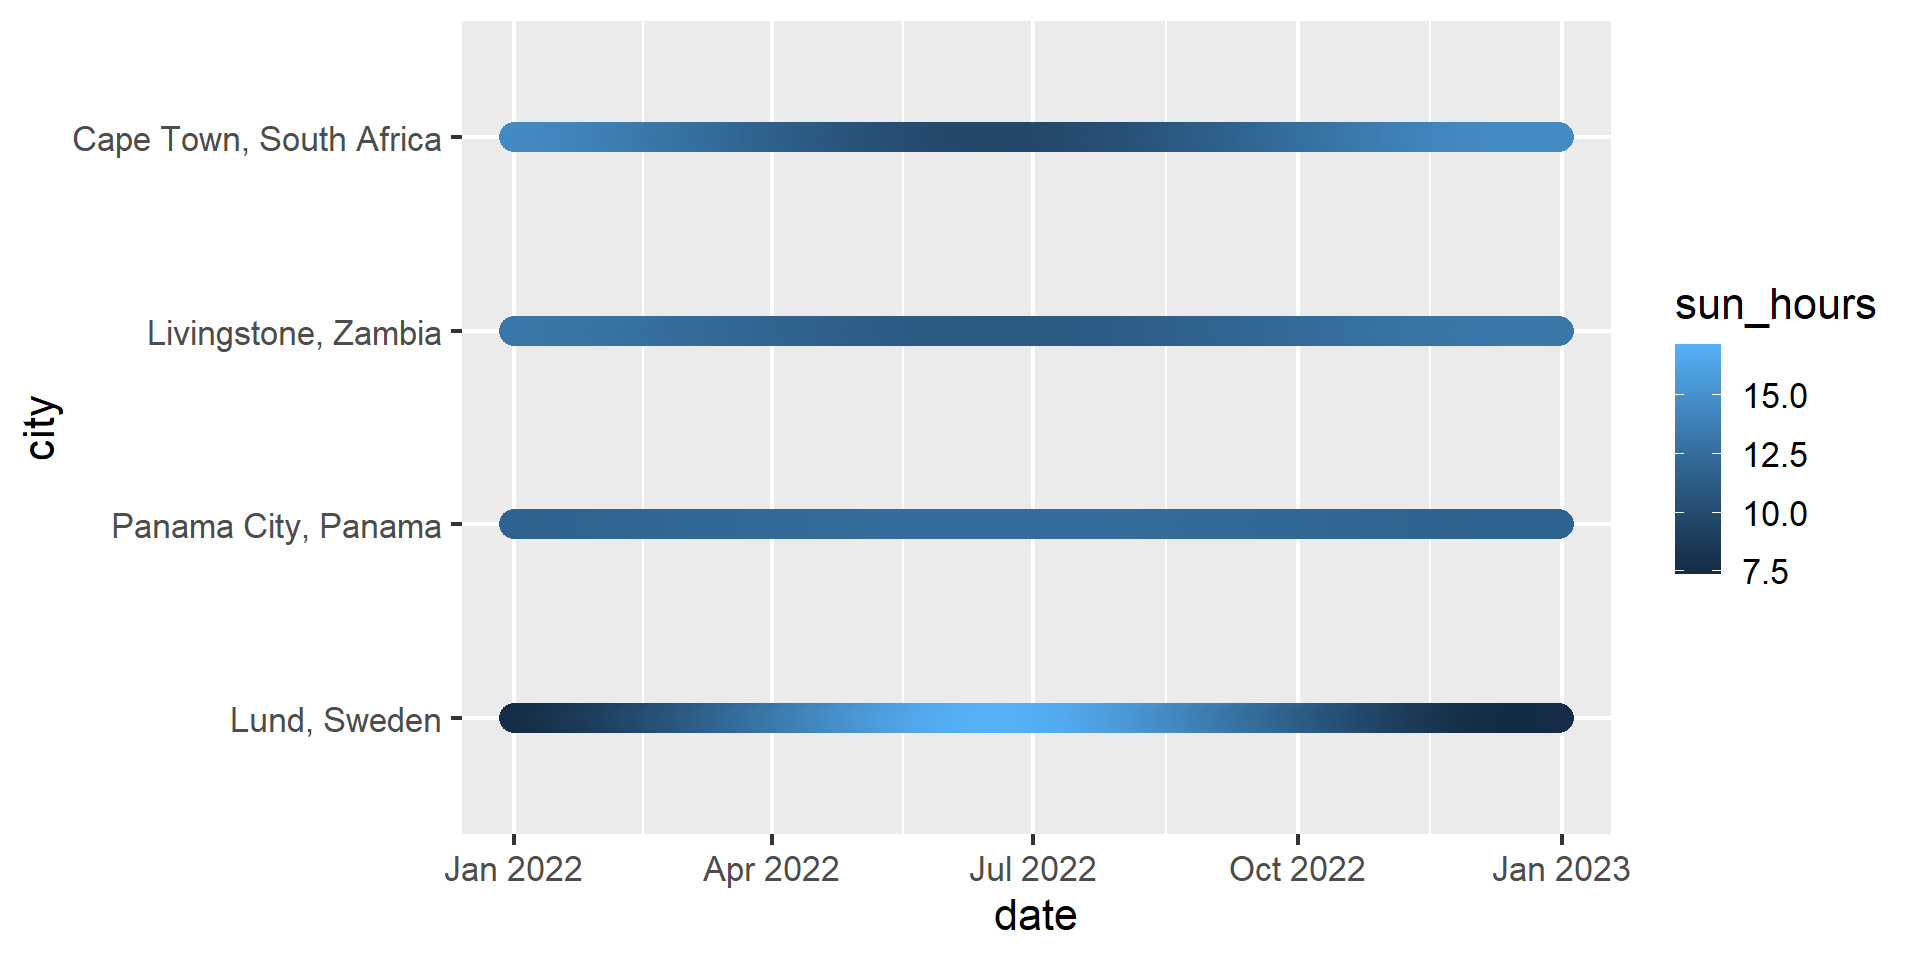
Sun hours mapped onto colour
We define the mapping with aes()
We define the mapping with aes()
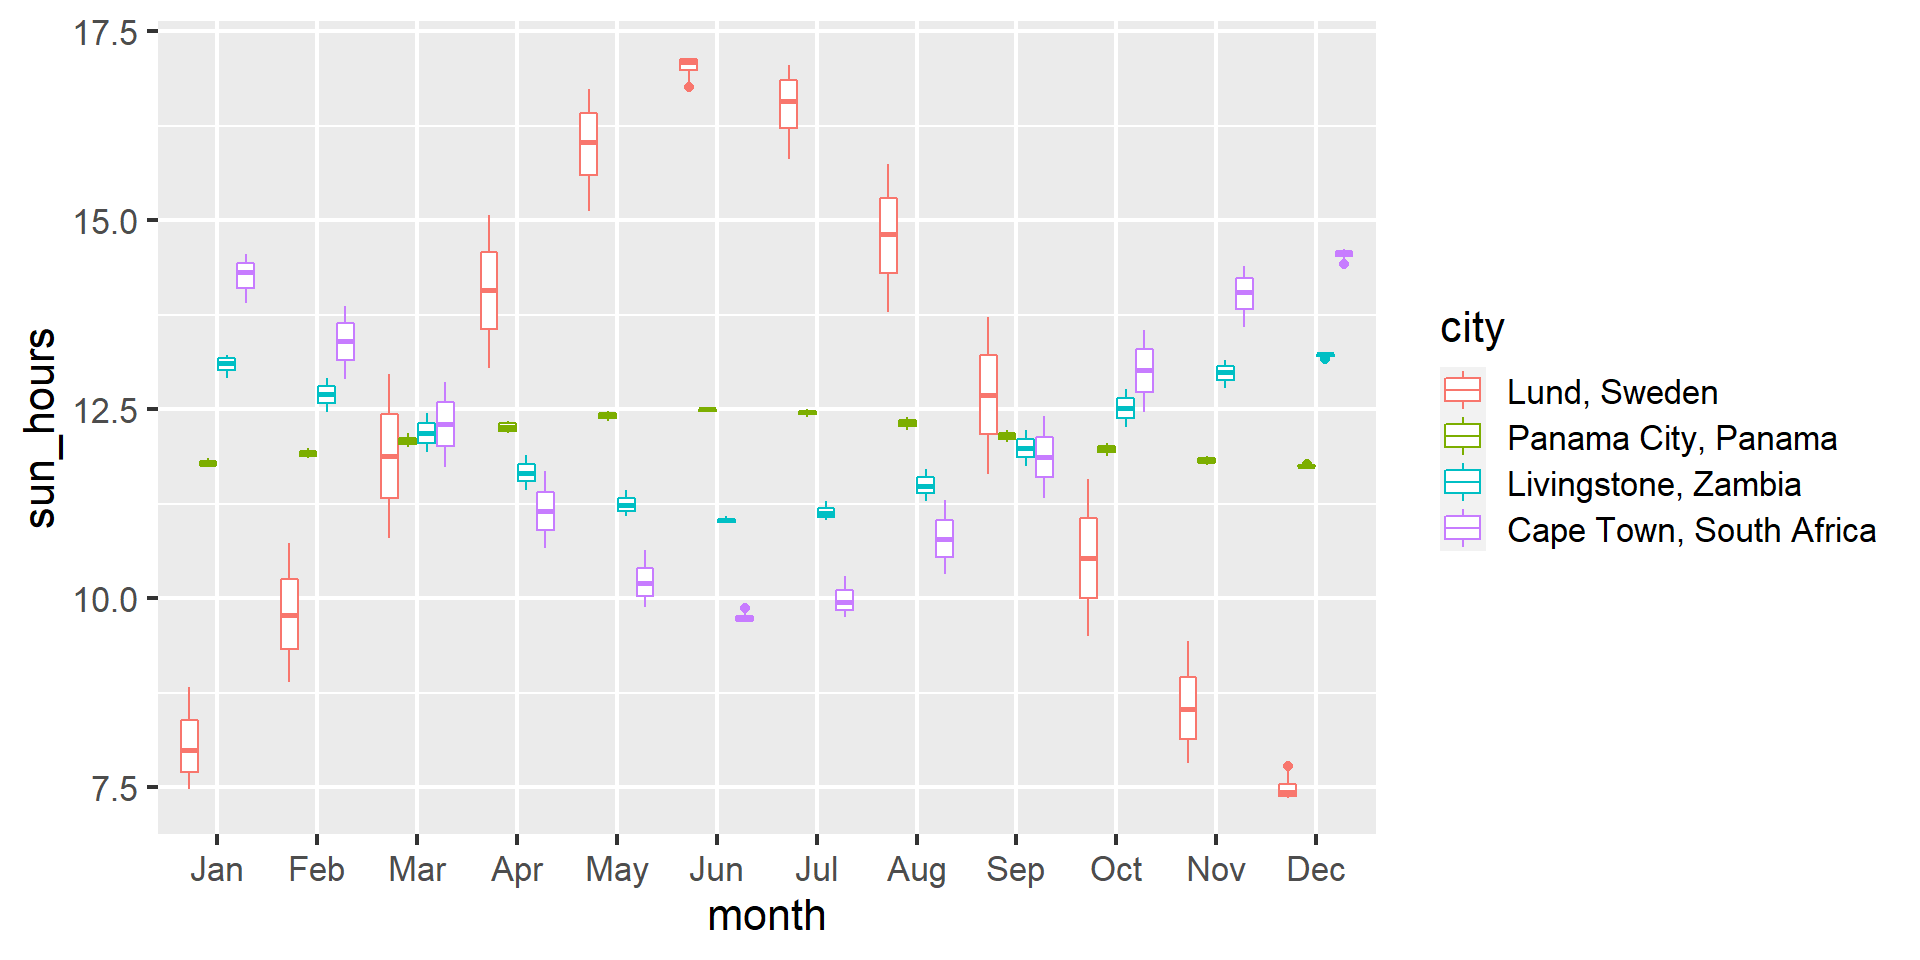
The geom determines how the data is shown

The geom determines how the data is shown

The geom determines how the data is shown

The geom determines how the data is shown
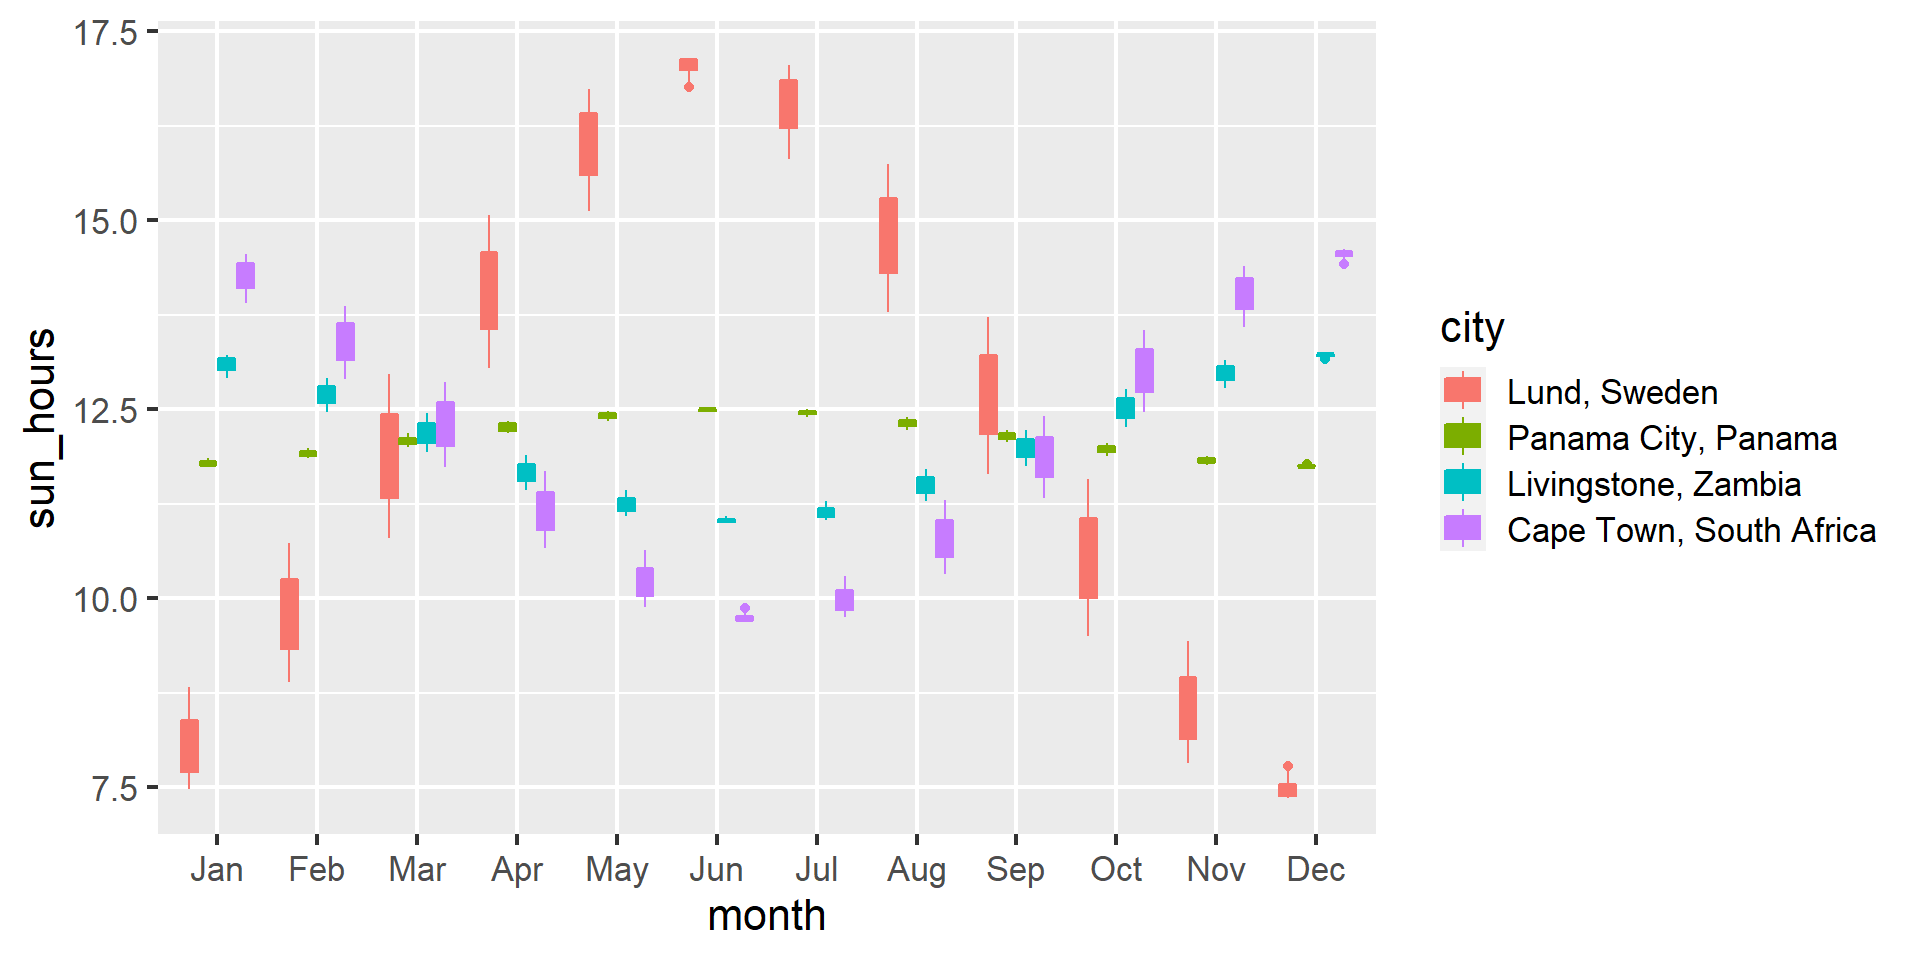
Many geoms have both colour and fill aesthetics
Many geoms have both colour and fill aesthetics
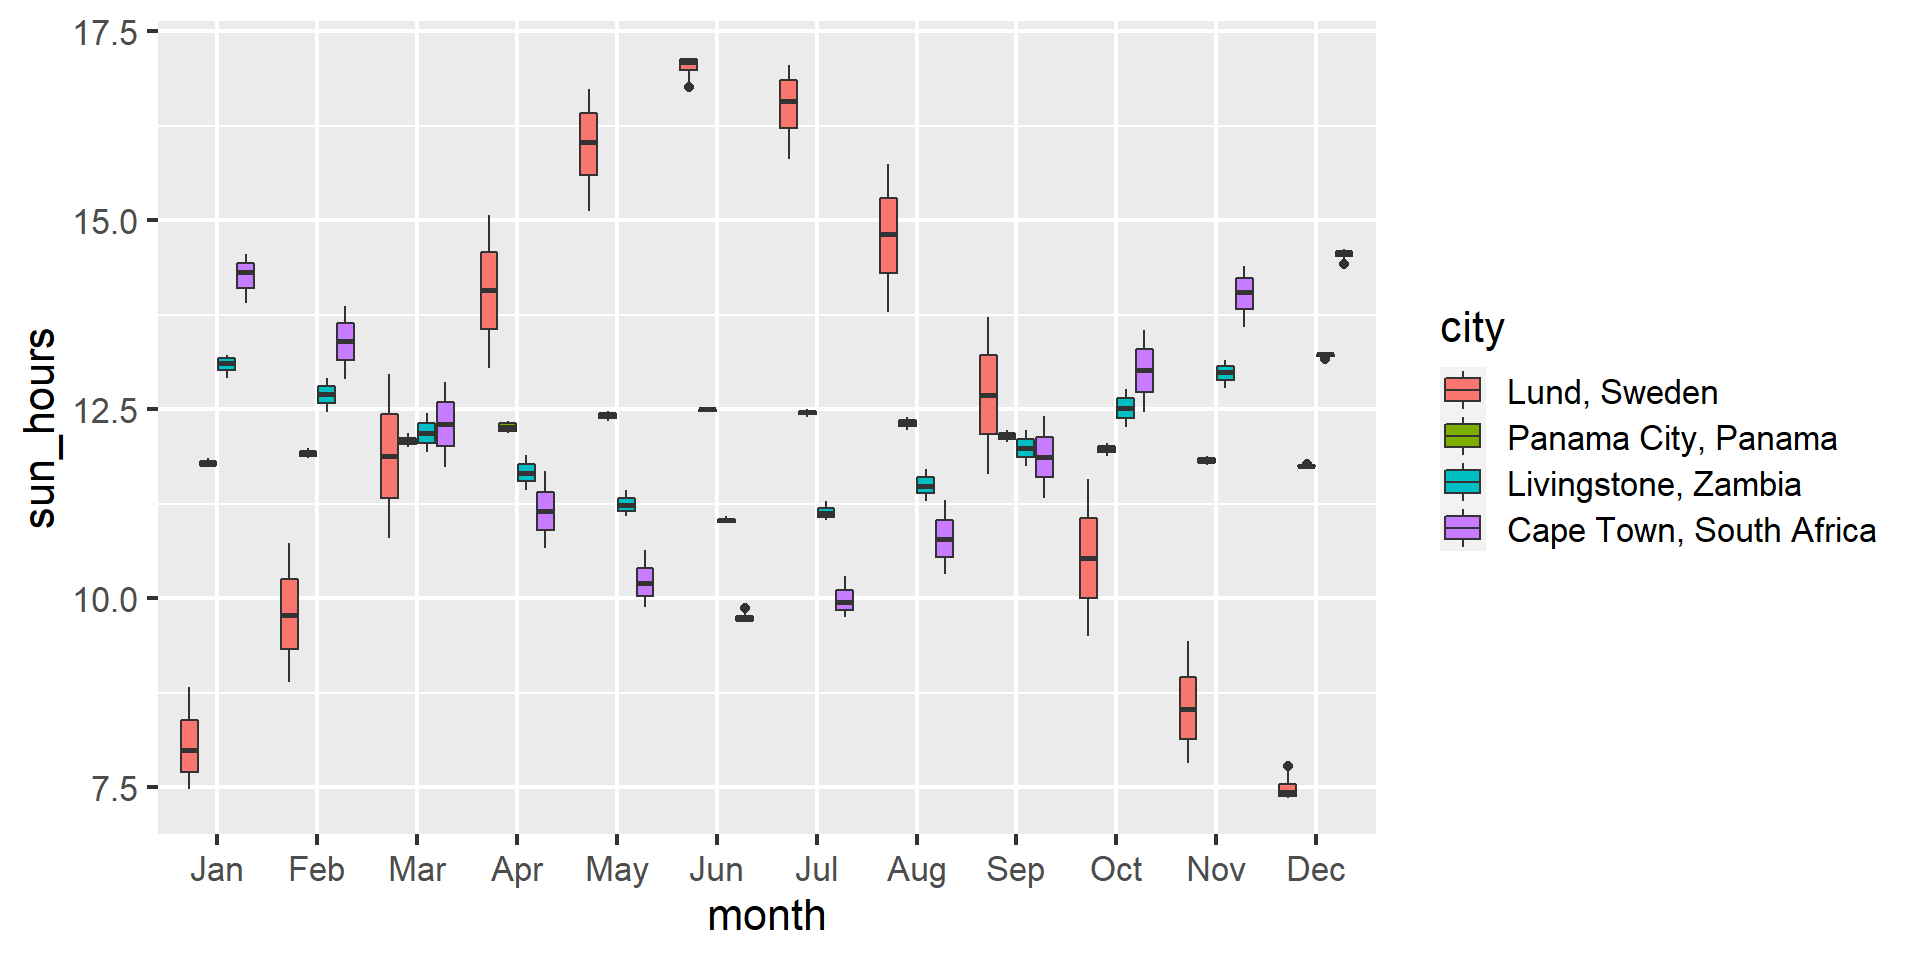
Many geoms have both colour and fill aesthetics
Aesthetics can also be used as parameters in geoms
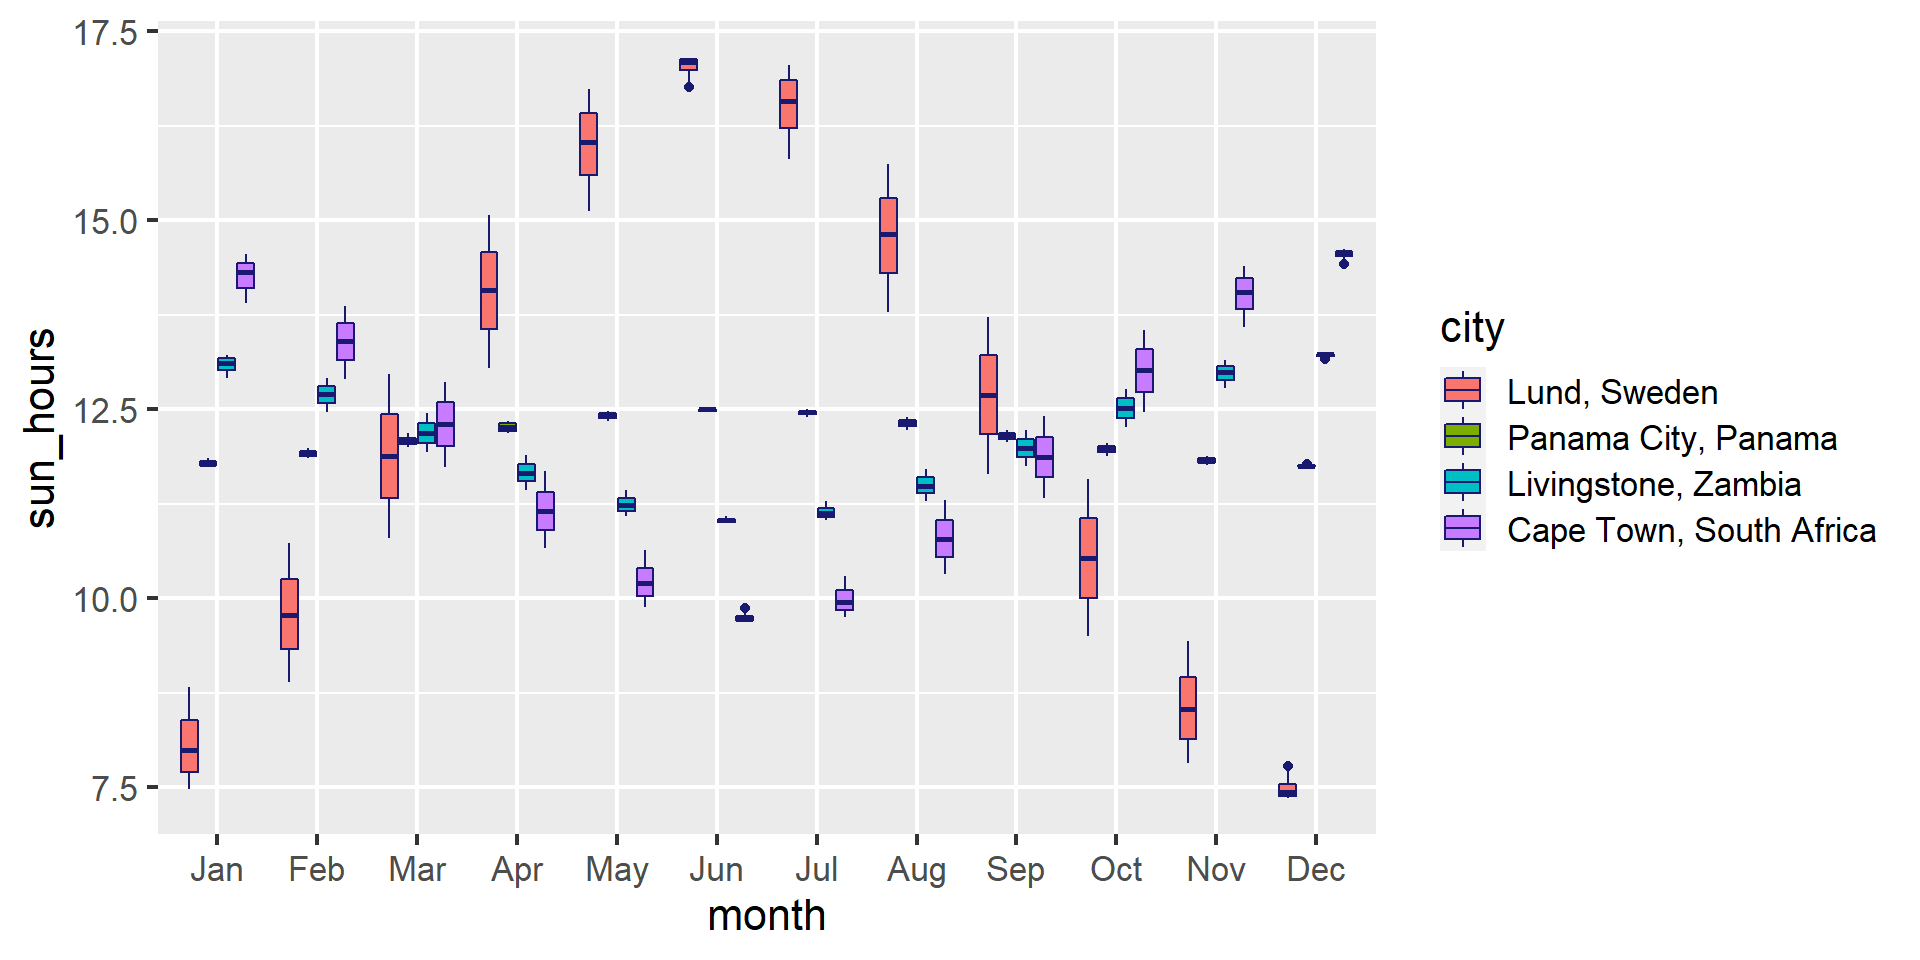
Aesthetics can also be used as parameters in geoms